Insufficient Capital June Update

This newsletter has been supported by ListedReserve, a fund manager focused on digital assets. While we do not focus on this space, we strongly appreciate the insights of a manager immersed in the area, and thoroughly enjoy reading their newsletter.

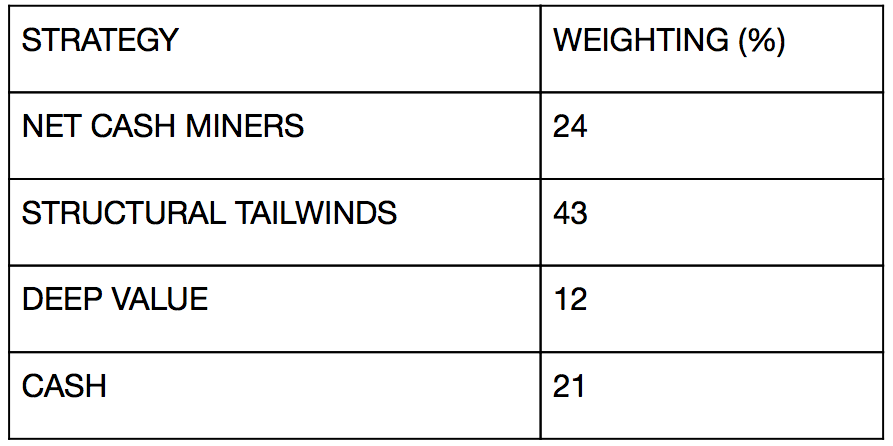
Key team members have recently graduated university and begun new roles – Peter is now a Portfolio Manager at Waterhouse VC, whilst Matthew is a buy side research analyst within a trading firm. Consequently, the portfolio has slightly shifted towards an increased allocation to passive investments: 13% is invested across two ETFs (focused on global equities ex-Australia) and 13% is invested across two LICs (focused on ‘value’ equities, particularly mining and energy). We will touch on the LICs in a future newsletter and discuss why they could outperform the index. Earlypay (EPY:ASX) is our largest position, with the top 3 positions currently representing 36% of the portfolio.

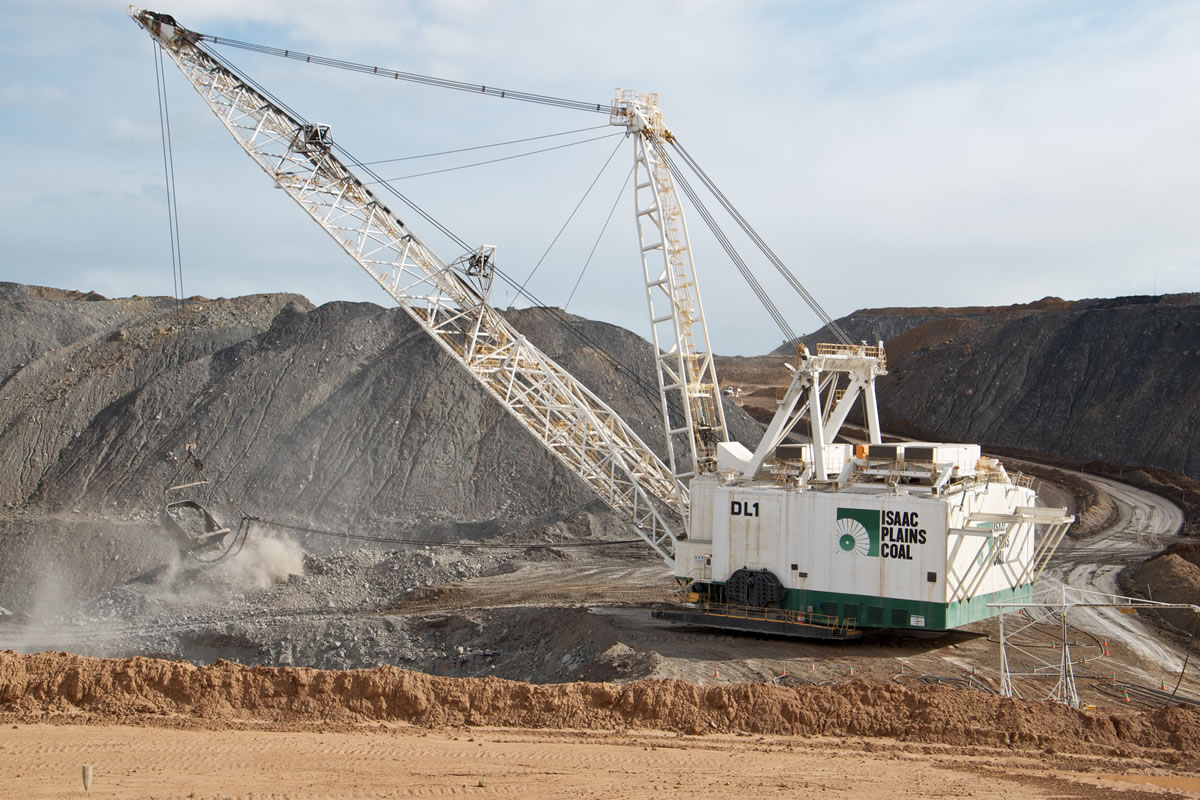
We will periodically discuss changes to the direct equity positions. Recent portfolio additions include: Dusk (DSK:ASX), Charter Hall Long WALE REIT (CLW:ASX), Allegiance Coal (AHQ:ASX) and Earlypay (EPY:ASX). We trimmed 10% of our Smartpay (SMP:ASX) position at $0.72 to rebalance the portfolio.

Cracks in the US economy are beginning to emerge.

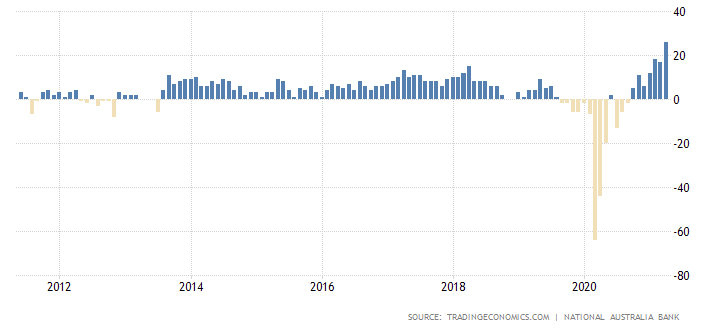
The ‘Loan Officer Survey’ asks banks if it is easier or more challenging to give new loans. This survey is a barometer for the US economy, with implications for credit availability. The recent upward movement (see the red line) indicates that it is becoming more challenging and that there is a high risk of widening credit spreads. Check out the prior three spikes (2001, 2008/2009, 2020) in both credit standards and the US HY Credit Spread – these were not great times for US consumers or equity investors.

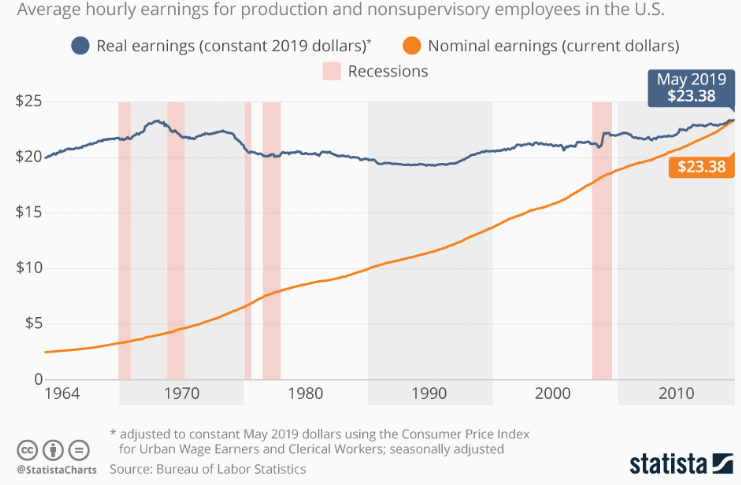
Walmart and Target both reported disastrous earnings, citing inflationary pressures on American households. Over the following days, Walmart closed down 11.4%, its worst day since October 1987 and Target fell 25% on their posted earnings. The US market is increasingly appearing fragile – in mid-May, Snapchat cited macroeconomic pressures as negatively influencing their recently published guidance. 

Even cryptocurrencies – favoured as a historically ‘uncorrelated’ asset class that is characteristically higher risk (and higher reward), has had its risk-off moment. The total market capitalisation of cryptocurrencies has fallen from $3T to $1.2T today, headlined by the collapse of Terra’s LUNA and TerraUSD (UST) – an event likely to be cited in economics textbooks for years to come.

The Fed is tightening into this negative backdrop. This is very different to March 2020. The lifesaver of the US consumer is reeling back its rafts.

MoneyBits is the crypto newsletter for investors (not naysayers).

Every Friday, Dan (ListedReserve’s founder) sends a newsletter on the fundamentals of the sector.

Yep, the fundamentals. Forget about bored apes and dog coins. It keeps us focused on the opportunities, and sceptical of the hype.

It’s trusted by top fund managers, VCs and wealth advisors too. Oh, and it’s free.

If you’d like to give it a try click here.

RPM Automotive

RPM Automotive (RPM) was founded by Clive Finkelstein (CEO and Managing Director) and Lawrence Jaffe (Executive Director) in 2013, as a group of diversified automotive businesses offering customers: tyres for commercial and passenger vehicles, vehicle servicing & repairs, roadside assistance, motor accessories, and motorsport safety gear.

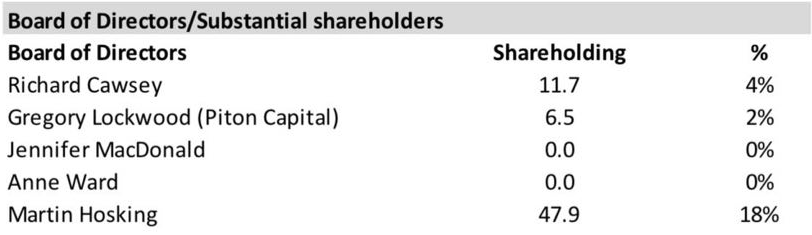
The company’s strategy encompasses both organic and inorganic growth, with acquisitions aimed at valuations of 3.5-5x EBITDA using around 50% scrip and 50% cash consideration. RPM applies a term payout to retain vendors in the business for 3+ years, with escrow applied to the scrip consideration. Original vendors of businesses acquired by RPM currently own 17% of the $50 million company.

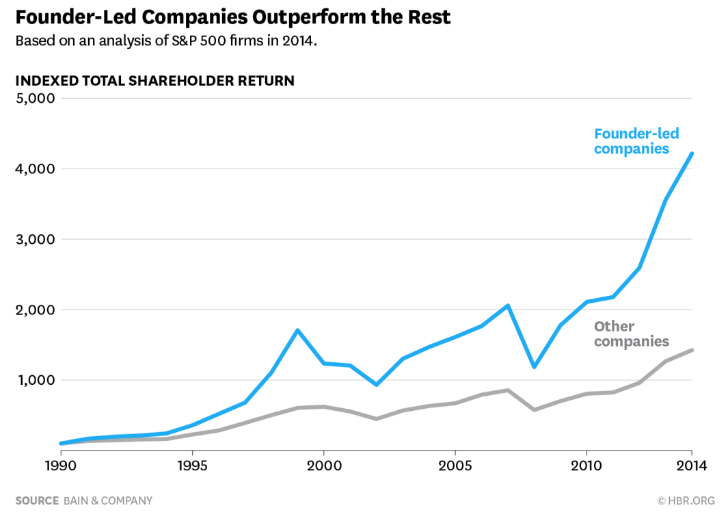
Clive and Lawrence remain significant shareholders, owning 14% of the company each. Clive is an industry veteran, having previously built and sold a parts and accessories manufacturer as well as a wholesaler and a 4WD franchise. We have a strong preference for investing in founder-led businesses. Founders typically have comprehensive knowledge, moral authority, and full commitment to a long-term vision rather than quarterly earnings.

In August 2021, RPM secured $8m of growth funding from Collins St Value Fund, which is a high performing Melbourne-based fund (returned 19.1%pa since inception). Collins St invested $2.5m in RPM at 30c and provided a 3-year $5.5m convertible note convertible at 35c with a 3.5% coupon. At the base of this newsletter, we have linked an interview with Michael Goldberg, Collins St’s Managing Director, where he discusses RPM.

In April, RPM’s management upgraded guidance for the financial year:

MetricUpgraded GuidancePrior Guidance
Revenue ($m)80-8578
EBITDA ($m)7.2-8.27+

We estimate that the business will generate around $3.1m of NPAT in FY22 and $5.5m+ of NPAT in FY2023. At a market capitalisation of $50m, the business is currently valued at circa 16x FY22 PE / 9x FY23 PE. Taking the middle of guidance, RPM trades at 5.9x EV/EBITDA – however, we care far more about cash flows than EBITDA for a business like RPM.

On an EV/EBITDA basis, RPM is far cheaper than ASX-listed peers, although it is undoubtedly subscale compared to them and certainly deserves a lower valuation multiple than ARB Corporation.

CompanyEnterprise Value ($m)FY2022 Forecast EBITDA ($m)FY2022 Forecast EV/EBITDA
ARB Corporation (ASX:ARB)2,55019613.0x
Bapcor (ASX:BAP)2,5502888.9x
Carbon Revolution (ASX:CBR)74-27n/a
National Tyre and Wheel (ASX:NTD)2191514.4
PWR Holdings (ASX:PWH)8043523.0
RPM Automotive (ASX:RPM)45.27.75.9x

RPM is clearly leveraged to the discretionary income of Australian consumers. We continue to monitor for the deterioration of economic conditions both globally and domestically, especially consumer spending, inflation and widening credit spreads. Representing 26% of group revenue, RPM’s ‘Motorsport’ and ‘Performance and Accessories’ divisions are particularly leveraged to discretionary spending.

In saying that, we are not macro strategists but mere stock pickers. Considering the operational expertise of RPM’s founders, the company’s strong balance sheet (net cash of $3.8m) and compelling valuation, as well as its long growth runway, we are happy to join Clive on his three-year plan for $150m+ of group revenue.

Quip of the Month

“Many fail to grasp what they have seen, and cannot judge what they have learned, although they tell themselves they know.” – Heraclitus (Greek philosopher of the late 6th century BC)

The Dunning-Kruger Effect is a type of cognitive bias where people overestimate their competence in one or several fields. Essentially, low ability people do not possess the skills needed to recognise their own incompetence!

The Dunning-Kruger Effect. Source: MedicineNet

The Dunning-Kruger Effect is certainly prevalent in public markets, where alpha is incredibly difficult to find. 83.1% of active funds have underperformed compared to the S&P500 over the last 10 years and underperformance rates around 80% have been recorded across the developed world. Such a damning statistic does not exactly exude confidence or encourage active management.

Anyone with a small pool of capital can compete to efficiently price public equities. Many people are incredibly bright and/or industry experts, with easy access to rich data points (such as website traffic data through Similarweb and unique business insights through Tegus) and powerful analysis tools such as CapIQ, Bloomberg and Sentieo. As technological capability and availability have increased over the last 50 years, the relative skill gaps between investors have narrowed significantly. We could not possibly know more about Facebook or CSL (pick any large cap) than anyone else and it would be a textbook example of the Dunning-Kruger Effect.

We have gradually realised that we must hunt where the rest of the world is not. Doing so in Australia, a country that only represents 1.03% of the global market is a great place to start. As of February this year, there are 2145 Australian public companies, of which, around 1850 (those outside the ASX300) have a market capitalisation below $800 million.

Global stock exchanges by market capitalisation as of December 2021. Source: Statista

For our large cap exposure, we generally prefer to own ETFs. We could feasibly gain an information edge over the rest of the market in smaller companies like RPM Automotive… although perhaps this too is putting the Dunning-Kruger Effect to practise.

Australian mid- and small-cap funds have fared much better than large-cap funds, with a slim majority outperforming their benchmark over most time frames. 51.2% have outperformed over the past 15 years.

Source: SPIVA

Larger and more developed markets, like the US, have much greater efficiency for mid- and small-caps. Perhaps it’s time for you to review any actively managed US exposure…

Source: SPIVA

Extraordinary outcomes are very unlikely to be achieved through ordinary actions. Small companies like RPM are likely to drive our entire outperformance… if we are fortunate enough to avoid the Dunning-Kruger Effect, and a myriad of other exciting obstacles.

If you would like further details regarding our activities, we encourage you to follow us on Twitter, where we share more regular bite-sized commentary. Email us at insufficientcapital@gmail.com.

See Michael Goldberg discuss the ‘special sauce’ of founder-led businesses, with specific reference to RPM here.

Kind Regards,

Insufficient Capital

Insufficient Capital September Update

Company in Focus: Allegiance Coal (AHQ:ASX)

We would like to apologise for the late newsletter. On a personal note, all of our team have now achieved the milestone of completing undergraduate engineering degrees. How this will correlate to improved stock picking remains to be seen. The top contributor during the quarter was EML Payments (EML:ASX) and the largest drag on performance was Smartpay (SMP:ASX).

Quarterly Portfolio Changes

There were 4 small portfolio changes during the quarter, including the purchase of Allegiance Coal (AHQ:ASX) and Charter Hall Long WALE REIT (CLW:ASX). This is the first time we’ve bought a REIT for 5 years. We have a positive view on CLW’s portfolio and a mildly contrarian view that offices and physical retail stores still have a future. 

We bought the REIT at an FY2022 yield of 6.2% and a discount to net assets greater than 5%. Higher inflation will have a positive impact on the income portion of our forecast return, with 40% of leases linked to CPI and 60% with a favourable 3.1% average annual rent review. CLW is reasonably geared at 31.4%, with an extraordinarily low average cost of debt of 2.1%. A summary of CLW’s portfolio (which has a long 13.2 year weighted average lease expiry) is shown below.

Summary of CLW’s Portfolio. Source: Charter Hall Long WALE public filings

CLW has an enviable tenant mix (see below), diversified between government (20%) and non-government (80%) tenants, as well as across multiple industries. 99% of CLW’s tenants are government, ASX-listed, multinational or national businesses.

CLW’s Tenant Mix by Revenue. Source: Charter Hall Long WALE public filings.

We are particularly excited by CLW’s ‘Industrial & Logistics’ segment, which represents 22.5% of the total portfolio. Our research has led us to comparable properties selling privately on cap rates as low as 3.5%, which is 23% lower than CLW’s average ‘Industrial & Logistics’ cap rate.

REITs like CLW will rarely be large portfolio positions because they do not meet our performance target of 25%/annum. Our investment in CLW demonstrates some of the main challenges of the current environment: 

  • Valuations have increased significantly throughout developed equities markets, especially for US growth equities. The Nasdaq has doubled over the last two years and the average PE ratio has expanded from 24.3x to 37.7x. This decreases the number of attractive opportunities and makes our hurdle a difficult yardstick.
  • Interest rates remain close to 0% despite US ‘real’ inflation running at circa 10%. There is obviously much debate about the exact figure. That 10% figure is sourced from Shadow Stats, reflecting their estimate of today’s inflation if it were calculated the same way it was in 1990. Holding cash is an incredibly unattractive proposition.

If contractionary monetary policy is finally used to dampen high real inflation, the cap rates of REITs will follow, negatively impacting real estate valuations. We hope that the quality of CLW’s portfolio and tenant mix, as well as increased distributions, will outweigh the negative impact of higher cap rates. In saying that, contractionary monetary policy could stop Australia’s multi-decade real estate party, which would be incredibly unpopular! The roaring 20s are likely to continue…

Allegiance Coal

We have been following Allegiance Coal (AHQ:ASX) for a number of months, and even more closely given the recent surge in coal prices. Allegiance is a metallurgical coal developer and operator, which owns 4 projects across North America spanning pre-approval to producing assets: 

  • New Elk – Ramping up Production
  • Tenas (90% ownership) – Environmental Authority to be submitted end of year
  • Black Warrior – Ramping up Production
  • Short Creek – Pending Permitting

As opposed to thermal coal, which attracts substantial negative public sentiment given greener energy alternatives, using metallurgical (coking) coal in a blast furnace is by far the cheapest and most effective way to manufacture steel.  The company trades at 60c/share, with a market capitalisation of around $210m.

Up until mid 2020, Allegiance was a single project play, holding 90% of the Tenas project in British Columbia, Canada. In late 2020, the company acquired New Elk (a mine placed in care and maintenance by its previous owner), and began investigating ways to establish production in a capital efficient manner, noting at the time that seaborne coal prices were at a low. New Elk kicked off production in May this year and recently shipped its first cargo. Management is targeting 1.8Mtpa of High Vol B coal (ramping up to 2.5Mtpa by 2024) across a lifespan of 25+ years for the project.

In 2021, the company made two strategic acquisitions: Black Warrior mine in Alabama and Short Creek mine in Alabama. Both acquisitions were at incredibly attractive prices despite strong coal markets and have very short payback periods.

New Elk and Black Warrior are both in a ramp up phase, selling trial cargoes to Asian customers, and samples to potential buyers worldwide for testing, with the aim to switch to index-linked long term supply contracts. 

Allegiance Sales and Production Profile – Insufficient Capital estimates that the company is approximately 2-4 weeks behind this schedule. Source: Allegiance Coal public filings.

Our thesis for Allegiance shares similarities with Fenix Resources (FEX:ASX), which we covered in our March newsletter:

  • At the time of coverage, both had near term production (in the case of Allegiance, already producing), which will result in strong near term cash flows
  • Both mined attractive products commanding a significant premium on seaborne markets

In contrast with Fenix, where we raised a few areas for concern (primarily around high production cost, single asset base introducing large project risk, short mine life – with minimal exploration potential, supply-side shocks from various other projects racing to market and a small concern over Chinese geopolitical risk with Australia), Allegiance owns a number of projects, with attractive production lives of 15+ years. Projects are on the lower end of the cost curve, with significantly less commodity price risk than Fenix (New Elk produces a blended product at about US$88/tonne; Tenas’ project economics are in the bottom quartile of costs). Allegiance is geographically diversified, not only across the US and Canada, but also with West/East Coast North American port access, allowing for flexibility to meet demand.

In addition to Allegiance’s ability to command a price premium from operating out of North America and having excellent access to multiple ports, the company also has significant optionality in blending coal to meet market requirements. Black Warrior, New Elk, and further offtake coal can be blended to take advantage of market demand, essentially able to extract value beyond the products by themselves.

Allegiance’s network of operating assets offer attractive blending opportunities and multiple Pacific and Atlantic port options. Source: Allegiance Coal public filings.

Beyond strategic blending opportunities and market access, management has made several accretive operationally focussed manoeuvres:

  • Acquired Black Warrior in July 2021 – a previously a family run business selling high grade met coal to a local power co-op as thermal coal, realising significantly less revenue than could be commanded on the seaborne market. The mine was materially undercapitalised, and management saw an opportunity to significantly increase production at a largely similar cost of production.
  • Agreed on US$25m in funding to construct a rail spur to shave US$6/tonne of unit costs for New Elk (at a production run rate of 2.5Mtpa over 25 years, the US$15m/annum of savings are significant).
  • Adjusted the New Elk startup plan to approximately half upfront capital costs (given the current challenges with obtaining labour – see ‘Key Risks’, we hate to think what the full blown startup with twice as many production units from the start would have looked like). 

On a macro level, ESG mandates mean that coal project financing and development (even for higher quality met projects) are not attractive to many players, reducing the risk of a supply glut even at inflated prices.

We do not believe that structural change in demand for metallurgical coal within the steel industry is relevant for a number of years, and it will take time for demand to fall. The reality is that there has never been greater demand for coal than there is today.

Key Risks 

The obvious question is whether coal prices are sustainable, and although we’d like to believe they are, as a rule of thumb we don’t speculate on commodity prices.

We have also seen the company experience operational delays in scaling New Elk’s production. These are not geological, but rather with regards to acquiring a suitable labour force near Trinidad, Colorado. As such, we do not see this being a long-term issue, but certainly one that affects scaleup (N.B. Black Warrior does not appear to be facing these constraints given the strong coal mining industry in and around Birmingham, Alabama).

Furthermore, unfortunate timing with regards to securing untested trial cargoes has meant that the first seaborne cargoes from New Elk and Black Warrior have been sold at substantial discounts (on top of weaker market prices). Due to this, there are a few months of these lower margin cargoes before Allegiance is exporting at high coal prices.

That said, Allegiance is well insulated from any downturn given its low-cost operations, and low financial leverage. Somewhat to our disappointment, the recent two acquisitions have been entirely equity funded (got to keep the brokers happy!) and this has left Allegiance with a healthy balance sheet heading into a period of strong cash flow. We anticipate that management will utilise these cash flows to fund a large portion of Short Creek and Tenas, such that future dilution should be limited as the company ramps production across its portfolio.

Conclusion

Allegiance is well on track to be a mid-low cost met coal producer, shipping 5Mtpa of high grade, geographically diversified, coal in a few years. Despite some delays in startup and delayed exposure to index-linked markets, operations are scaling up and we believe that the market has assigned too great a discount for these brief inconveniences.

Given our forecast for the company to exceed $100m/annum EBITDA run rate (valuing the business at less than 2.1x EBITDA) within months at current coal price levels, the company’s multi-decade asset life with a strong development pipeline, and low costs of production, we believe that Allegiance is an incredibly compelling investment proposition with multiple traits that set it apart from other ASX coking coal companies. Furthermore, listed peers are valued at higher forward earnings multiples – Warrior Met Coal (3x EBITDA), Coronado (2.4x EBITDA), Alpha Metallurgical Resources (2.6x EBITDA), Arch Resources (2.9x EBITDA).

Quip of the Quarter 

“Buy land, they’re not making it anymore.” – Mark Twain (novelist best known for his adventure stories of American boyhood).

One would expect land values to increase at a faster rate than inflation – specifically, they should follow a combination of population growth, economic growth and technological advances. Peter Lindert’s 1988 paper “Long-run Trends in American Farmland Values” discusses the consistent growth of US land values since 1805 – see Lindert’s findings below. We have split the data into two analysis periods (the first being the entire period from 1805-1980; the second being 1930-1980). From 1805-1980, CPI averaged 1.12%pa whilst land appreciated 2.02%pa (+0.9%pa real return). From 1930-1980, CPI averaged 3.24%pa whilst land appreciated 5.93%pa (+2.69%pa real return). Of course, this brings us back to the question of ‘real’ inflation. Since 1980, the Bureau of Labor Statistics altered the methodology behind CPI calculation in order to account for the substitution of products and quality improvements (e.g. newer generations of technology priced higher but more powerful – such as iPhone 8 vs iPhone 7). The 1805-1980 data range is unaffected by these changes to the CPI calculation.

However, the concept of scarcity is being turned on its head. Old-world scarce assets (such as land, gold, baseball cards, unique number plates, Ferrari 250 GTOs) are turning digital through digital certificates of authenticity, verified through a public blockchain. There are now entire decentralised digital worlds built by the community. Decentraland (which is the oldest of these worlds) has its own limited supply of ‘LAND’, which is an NFT that represents land in Decentraland. These land parcels can then be developed and economic value can be extracted by offering experiences (such as games) to participants. In 2019, parcels of land in Decentraland were swapping hands for around US$500. Today, they are being sold for circa US$10,000, a 20x increase. 

Perhaps Twain’s quote should be altered to “Buy tangible land, they’re not making it anymore.”

With the advent of digital assets, has the value proposition of scarce tangible assets been put into question? Our position in CLW implies our stance – there’s enough room in this world (including virtual worlds) for many forms of scarcity.

If you would like further details regarding our activities, we encourage you to follow us on Twitter, where we share more regular bite-sized commentary. Email us at insufficientcapital@gmail.com

Insufficient Capital March Update

Performance Figures

The portfolio rose +16.46% over the third quarter of the Australian financial year, outperforming the ASX200 performance of +4.20% by +12.26%. This takes our financial year to date performance to +52.69%. The top contributor during the quarter was Smartpay (SMP:ASX). The largest detractor during the quarter was Afterpay (APT:ASX). The portfolio currently has 10 positions, 1.85% cash and is most heavily weighted to our ‘Structural Tailwinds’ strategy. Our structural tailwinds investments are typically classified as ‘growth’ investments, an area which is particularly topical at the moment – there is a widespread focus on the ‘reflation trade’ and ‘value rotation away from growth’ (an increased interest in traditional value investments with strong near-term cash flows). The recent increases in the risk free rate continue to threaten lofty tech valuations. Our largest three holdings represent circa 50% of total FUM (including cash).

Quarterly Portfolio Changes

There were three small portfolio additions during the quarter, including the purchase of Healthia (HLA:ASX), a burgeoning allied healthcare operator. HLA is targeting the deployment of at least $20 million of capital for the acquisition of allied healthcare businesses throughout FY2021 – this should result in continued EPS accretion, with the group benefitting from some economies of scale. More detail to come in a future newsletter.

Investor Presentation for Half Year Ended 31 December 2020 (Healthia Limited)

We are still building our positions in two other portfolio additions and will disclose them in a future newsletter. Both positions are microcaps valued <$100M at time of purchase.

One addition is a tech-enabled cashflow finance provider which could pay a yield of around 6.5% over FY21. The firm is a rare beneficiary of the March wind-down in government stimulus, with increased demand for working capital across SMEs.

The other addition is a vertically integrated group of Australian automotive aftermarket businesses. The firm is making strategic acquisitions whilst organically growing their core brands and is currently valued at circa 7.5X forward EV/EBITDA, with a net cash position and close to 70% insider (members of the Board, management & vendors of previously acquired businesses) ownership.

BetMakers (ASX:BET)

In our last newsletter, we flagged that we would discuss BetMakers, a recent addition to the portfolio.

Rocky Beginnings

Investors could be forgiven for looking at BetMakers and throwing it in the ‘too hard basket’. In early 2019, the firm transitioned from a highly competitive industry to an attractive investment proposition. Founded in 2011, the company initially aimed to build B2B software products for betting companies, while also competing against them with their own retail betting business. When you are competing against large corporate bookmakers (e.g. Flutter [LON:FLTR]), the capital requirements to win and retain customers are vast. Between its listing (under the name, TopBetta) in December 2015 and June 2018, the company had not produced a dollar of positive operating cash flow. Existing investors were diluted as the company continuously tapped investors for more capital.

The Pivot

Then it all changed. The firm sold their bookmaking businesses (TopBetta and Mad Bookies) to PlayUp for $6 million and acquired Dynamic Odds (DO) and Global Betting Systems (GBS) to round out their suite of leading B2B products. BetMakers now compiles over 100 data feeds from racing jurisdictions around the world and supplies it to bookies via a single integration. They are essentially a middleman between racing authorities and bookmakers getting paid by both sides.

BetMakers produce and distribute data for racing bodies. That data is required by bookies to deliver a racing product – race fields, speed maps, commentary, official prices and live vision. The bodies charge bookmakers 2-3% of turnover to bet on their ‘product’ and pay BetMakers in return for packaging it up and also supplying the data needed to monitor the integrity of their sport. For bookies, it’s better to use BetMakers rather than linking up with every single racing body globally, and far cheaper than building in-house capabilities.

The Opportunity

BetMakers distribute over 200,000 races every year, half of which are international races into the Australian market. Clients include the majority of major corporate Australian bookies, close to 40% of the tier one bookmakers in the United Kingdom and new customers in the burgeoning United States market. These recurring, contracted revenues are being deployed into improving their products and developing new B2B revenue streams.

The company is inserting itself between more racing bodies and wagering operators, providing content and clipping the ticket on turnover. If this market grows as expected, further deals in the United States could provide significant revenue upside. To give some context, the US has 87 thoroughbred race tracks and twice as many races each year as Australia.

Sportech Acquisition

In late November 2020, BetMakers announced a transformative acquisition of three of Sportech’s core divisions. On Christmas Eve, after a competing bid for Sportech’s entire business was dismissed, Sportech shareholders voted in favour of the proposed acquisition by BET for AU$56.2 million. BET gained Sportech’s:

  • Tote business (USA, Latin America, UK and Europe) – provides B2B hardware, software, support, race day controls, parimutuel pool interfacing and co-mingling to racetracks, casinos and other venues
  • Americas digital business – provides white label B2B digital betting solutions to Advanced Deposit Wagering / Online Racing Bookmaker operators
  • Tote software engine, “Quantum”

Post-acquisition, BET will have contracts with >95 new tote customers, >200 racetracks and venues, and >25 service agreements for white label digital betting platform solutions. The three divisions listed above generated AU$46.9 million in revenue and AU$6.9 million in EBITDA in FY20. Thus, BET is paying 1.2X EV/Sales and 8.1X EV/EBITDA for the divisions – we view this as a great deal when considering Sportech’s high quality recurring revenue and cross-sell opportunities.

Strategic Acquisition and Capital Raising Investor Presentation, 1 December 2020

Coupled with BetMakers existing business, the combined business would have delivered AU$56.1 million in revenue and AU$7.7 million in EBITDA during FY20. Furthermore, management expects strong growth from the combined business, including significant synergy and cross-sell opportunities from BetMaker’s existing operations. We believe that the business could generate over AU$10 million of EBITDA in FY22 (and ultimately, generate a 15% net margin over the long run). This would value the business at around 70X 2022 EV/EBITDA and 13X 2022 EV/Sales. We envision possible growth of 30%/annum over the next 5 years across both the top line and EBITDA line – such an achievement would render today’s valuation cheap.

By no means could we ever argue that paying today’s BetMakers multiple for any business is inherently cheap. However, we cannot reiterate enough that BetMakers’ clients simply could not function without their services. They have a symbiotic relationship. It is comparable to operating an e-commerce business through Shopify. Once a business is using Shopify, so many headaches and operational problems are alleviated that it is a pleasure to remain a loyal, loving customer… and pay Shopify an annuity stream. Shopify is currently valued at around 210X 2021 EV/EBITDA and 32X 2021 EV/Sales. In saying that, relative valuations are a very dangerous tool – when the tide is rising, ‘fair’ comparable multiples can delude even the most rational investor. We believe that such a phenomenon has occurred in the Buy Now Pay Later industry.

Describing the acquisition of Sportech as ‘transformative’ is an understatement. The acquisition massively derisks an investment in BetMakers – we expect an improved liquidity profile and increased broker coverage. At a share price of AU$1/share, BET’s market capitalisation (after raising AU$50 million at AU$0.60/share to fund the acquisition) of AU$776 million is a far cry from its prior microcap status. Pre-acquisition, the business generated <AU$1 million in EBITDA last financial year. Management can now leverage off Sportech’s existing clientele and profitability to scale the business, particularly in the United States.

A Promising Trip(p) Ahead?

In February 2021, BetMakers announced a $75 million strategic placement at $0.70/share to accelerate their global B2B wagering strategy. The placement left BetMakers with a significant net cash position of circa $110 million to continue the execution of strategic opportunities. The placement was spearheaded by industry leader, Matt Tripp, who invested $25 million. Tripp has had an illustrious career in online wagering including roles as:

Chairman of Sportsbet (March 2011 – April 2013, with numerous roles prior to 2011)

CEO of CrownBet (March 2014 – May 2020)

CEO of BetEasy (August 2018 – May 2020)

Executive Chairman of the Melbourne Storm rugby league club (May 2020 – Present)

Further to his participation in the placement, Tripp has been contracted as a strategic advisor to BetMakers, focusing on the execution of ‘strategic’ and ‘transformative’ deals.

A ‘strategic’ deal constitutes a binding transaction which stems from Tripp’s introduction or reasonable assistance and results in an increase in company revenue by more than 10% on a pro forma basis. If a ‘strategic’ deal is achieved by February 2023, Tripp will receive 35 million unquoted performance rights convertible into 35 million shares for nil consideration.

A ‘transformational’ deal constitutes a binding transaction which stems from Tripp’s introduction or reasonable assistance and results in an increase in company revenues and EBITDA by more than 100% on a pro forma basis. If a ‘transformational’ deal is achieved by February 2023, Tripp will receive 32 million unquoted performance rights convertible into 32 million shares for nil consideration as well as 32 million unquoted options at $0.70 per option.

Thus, if all rights and options are converted, Tripp will have 134,714,286 shares in BetMakers (inclusive of the $25 million original placement). This would equate to approximately 14% of the company. The deal reinforces our conviction in BetMakers’ technology, growth strategy and driven management.

Fenix Resources (ASX:FEX)

We have a small position in Fenix Resources, one of many fortunate beneficiaries of a truly meteoric rise in the iron ore price.

Iron Ore (62% CFR China) 3 Year Price ($US/Tonne) Chart (Market Index)

Fenix operates the Iron Ridge Hematite Project in the Midwest of WA. The Iron Ridge project aims to provide around 1.25mtpa of high-grade DSO for a small mine life of around 6.5 years. At first glance, Fenix and its boutique project appear atypical from our common portfolio selections. Moreover, in terms of resource investment, the project is far from compelling with respect to production scalability and potential resource growth. That being said, Fenix’s simplicity is part of its allure – its simple project metrics and economics create a compelling investment in the current commodity cycle and the company’s current position has an asymmetric risk profile.

Brief History of Fenix Resources (11th November 2020 Fenix Resources Presentation)
N.B. Subsequent to the release of this presentation, the company has reached steady state production and begun shipping ore.

Fenix is currently valued at a market capitalisation of about $107m (at 23.5c/share) and is debt-free with ~$10m cash on the balance sheet – although we expect a considerable portion of this to be used in the January quarter (since about half of Iron Ridge’s capital costs are payable after commercial production is achieved). Incidentally, this will coincide with the first payments for their Iron Ore, so we are confident in the company’s ability to operate without further dilution. 

Iron Ridge would not be considered a favourable operation by most investors:

  • Iron Ridge is a basic project, single pit operation, with a single excavator and low-level processing. The mine is only targeting 1.25Mt of ore a year (by means of comparison, Hancock’s Roy Hill project produces >60Mtpa).
  • Iron Ridge has a relatively high cost of production (estimated at $76.86/dmt FOB per Fenix’s feasibility study completed in late 2019).
  • Iron Ridge’s life of mine is only 6.5 years
  • Iron Ridge’s location and small scale mean that the only feasible method of transporting ore to port is trucking it 490km to Geraldton.
Iron Ridge Site Layout and Satellite View

So what attracts us to Fenix? We view Fenix as an attractively priced call option on Iron Ore with an opportunity at present to generate enough cashflow to minimise iron ore commodity risk in subsequent years. Over the past 9 months, the company has significantly derisked itself, from obtaining its mining licence to making its first shipment of ore in late February. Furthermore, over this period, key factors affecting the underlying economics of Iron Ridge have materially improved.

At the time of the feasibility study, Fenix reported that at an $US78/dmt price for 62% Fe and exchange rate of $US0.70/AUD, the company would achieve an average annual EBITDA of over $16.4m across the life of mine. Since then, whilst the Australian dollar has appreciated to USD$0.76/AUD, the 62% Fe index has risen over 50% in Australian dollar terms.

Iron Ore Index Price subsequent to Feasibility Study – Source: Factset, Google Finance (N.B. CFR price – including shipping cost, not FOB which Fenix’s offtake agreements are arranged in. Iron Ridge’s DSO trades as a premium to the 62% index, reflecting its average grade of ~64%)

Fenix’s internal modelling suggests that a US$1 increase in the 62% Fe index will contribute $1.6m to EBITDA, and a  US$0.01 movement in the exchange rate impacts $1.5m. Some crude back of the envelope calculations evaluate the annual EBITDA at current price and exchange rate to be somewhere north of $100m EBITDA (we get ~$130m ceteris paribus).

Graphical illustration of Fenix’s published sensitivity analysis, not accounting for changes in other operating expenses e.g. Diesel  – current location roughly in red.  

However, as discussed previously, the project is fairly limited and is fairly sensitive to the underlying iron ore price. The company’s $76.86/dmt FOB production cost (effectively even higher CFR cost) puts it in the higher reaches of the iron ore cost curve, and even the premium commanded by the grade is not sufficient to stop Fenix from being a relatively low margin producer. 

2020 Iron Ore Cost curve (CFR cost)  (Source: Macquarie Commodities, Klaveness Research) – Fenix would fall well to the right

The project’s current life is 6.5 years, and whilst further development may be able to be done, it is unclear what the economics of any development would be. In February this year, Fenix signed a farm-in agreement with neighbouring Scorpion Metals to expand Iron Ridge’s scope. Whilst we applaud management’s proactivity in looking to extend the project, the reality is that there are still significant uncertainties with this avenue. As a result, when evaluating the project, we do so at face value, ignoring any development upside.

All this considered, the elephant in the room is where the iron ore price will go – this is something we cannot predict well – indeed when we invest in the resources industry we tend to buy attractive projects with a strong margin of safety on the commodity. It would be incomplete to not address it in part. The surge in iron ore prices over the last year have come from strong Chinese demand off the back of government stimulus, as well as crippled Brazilian supply. Despite Brazil being one of only a few nations to still be posting record day on day COVID-19 infections, it appears that Vale is managing to get production and exports back on track. Recent developments in China have also created concern in the market – with steel production ordered to be cut in certain cities due to environmental concern. While we keep an eye on the global iron ore market developments, the reality is we feel that Fenix’s attractive valuation more than compensates this risk at present.  Furthermore, growing Chinese environmental concern could be positive for Fenix’s higher-grade ore, which requires less coking coal to be turned into steel. We do not subscribe to any speculation surrounding a supply glut from Indonesian or African supply coming online – the larger-scale projects in these countries are still a number of years out, again Fenix’s short-term focus negates this risk.

Whilst Fenix, in our view, is unlikely to be the next Fortescue, the stars have aligned for a project delivering high cash flows, delivering what we perceive to be asymmetric risk. Management has proven themselves to be competent in project execution (starting production on schedule and even achieving steady-state production a month earlier than planned). This all works in Fenix’s favour, leading the investment thesis to boil down to a race between Fenix producing and shipping iron ore at these price levels, and Brazilian iron ore supply ramping up.

In the interests of attention span (provided that you are still reading), we will be delaying our regular ‘Quip of the Quarter’ until our next newsletter. We believe that it is a particularly significant quip which should not be tucked away at the end of a long newsletter.

If you would like further details regarding our activities, we encourage you to follow us on Instagram and Twitter, where we share more regular bite-sized commentary. Email us at insufficientcapital@gmail.com.

Insufficient Capital June Update

Company in Focus: Earlypay (EPY:ASX)

Our first newsletter was sent on 8 May 2019 to 31 close friends and family. This quarter’s newsletter was sent to nearly 2000 people. Thank you for your continued support. Since 1 July 2019, our portfolio has outperformed the ASX200 (including dividends) by 4.9 times, with performance of 84.9% compared to ASX200 performance of 17.4% over the two financial years.

Performance Figures

The portfolio fell -3.07% over the fourth quarter of the Australian financial year, underperforming the ASX200 performance of +8.23% by -11.30%. Whilst disappointing, this quarter takes our 2021 financial year performance to a very pleasing +48.00%, outperforming the benchmark ASX200 by a significant +20.47%. The top contributor during the quarter was Healthia (HLA:ASX). The largest detractor during the quarter was EML Payments (EML:ASX). EML Payments was one of our largest positions until the Central Bank of Ireland raised “significant regulatory concerns” about anti-money laundering compliance in Prepaid Financial Services, which EML acquired last year. On 19 May, when the issues were revealed, the stock fell 49%. EML has since recouped some of these losses but is a tender reminder that a high conviction portfolio carries high volatility due to stock specific risk. We have not made any changes to our EML position and await the Central Bank of Ireland’s decision, noting that past precedents point to a financial impact less material than the valuation decrease indicates.

The portfolio currently has 3.1% cash. The largest three holdings represent 44% of the portfolio. By our own categorisations, the portfolio is split between approximately 44% ‘value’ (cash flows weighted towards the near term) and 56% ‘growth’ (cash flows weighted further into the future). 

Quarterly Portfolio Changes

There were 4 small portfolio changes during the quarter, including further purchases of Earlypay (EPY:ASX), RPM Automotive (RPM:ASX) and BetMakers (BET:ASX), as well as a partial sale of Cadence Capital (CDM:ASX). All companies have been covered in prior newsletters available on our website.

Earlypay

Earlypay is a $110 million invoice financing and equipment funding business, which is highly cash generative and well-capitalised, fresh from raising $18.8 million. Earlypay was originally named CML Group and only rebranded in 2018 to the far catchier and ‘techy-sounding’ name we know today. Perhaps management hoped that the market would confuse this boring lending business for a sexy buy now pay later… although Earlypay is far too profitable and its default rate (<0.1%) far too low to make that mistake.

What is Invoice and Equipment Financing?

Invoice financing businesses front customers’ money based on their outstanding invoices. When the invoice is collected, it is paid into a separate account from which Earlypay’s fees are deducted and the proceeds are distributed to the invoicer. This type of financing is extremely popular as no security external to the invoice is required. Consequently, the financing can scale as businesses (and invoices) scale, and typically have higher approval ratings given the security of invoice. For businesses dealing in larger invoices with longer payment terms, Earlypay unlocks valuable cash flow. In FY2020, invoice financing represented 72.7% of Earlypay’s revenue and 66.5% of EBITDA. Equipment financing makes up the remaining 27.3% of Earlypay’s revenue and is relatively self-explanatory. Demand for equipment finance is supported by boisterous Australian infrastructure spending. For example, over 700 trucks and commercial vehicles are currently funded by Earlypay.

Industry Fragmentation 

Both the invoice financing and equipment financing arms are heavily fragmented – we see this as an opportunity rather than a risk. Whilst the largest four Australian banks all have trade financing arms, these typically service larger businesses – Westpac for instance, start at $500,000). The integration of Skippr (addressed below) allows Earlypay to provide financing from $20,000. One recent development in the space is the re-entry of CBA into invoice financing, powered by Waddle (similar technology to Skippr, acquired by Xero late 2020). This is a fairly significant development, not only given CBA’s scale – but also given its focus beyond the typical larger businesses to SMEs starting at $50,000. The product, dubbed “Stream Working Capital”, will be a direct competitor to Earlypay’s offering. The pie is large enough for Earlypay to generate significant transaction volume with miniscule market share.

Aussie Aussie Aussie

Australian business confidence is a useful barometer for SME lending appetite. With Australia fortunately coming out of the initial COVID-19 downturn far sooner than other developed nations, business confidence has returned to record highs with a vengeance amid record capacity utilisation and forward orders.

10 years of Australian business confidence (Trading Economics)

Attractive Yield and Earnings Profile

The chart below shows Earlypay’s annual dividend history since listing in 2010 and each year’s respective yields (nominal dividend in cents per share is shown in blue, approximate yield is shown in green). The average yield since listing is 5.9% and the company has paid a dividend every year since listing. Whilst we are not dividend-hungry, as stated in our ‘Ground Rules’ (see Number 9), we always look to re-invest dividends when a company offers discounted shares. Earlypay offers a lucrative 5% discount on reinvested dividends, which we will gladly participate in to cheaply fund further growth of the loan book. The 2021 expected dividend of 2.3c is sourced from management’s own forecast. Our 2022 dividend estimate of 3.2c is based on our 2022 forecast earnings per share of 5.33c and management’s target of a 60% payout ratio. This EPS equates to $11.6 million of earnings (36% growth on management’s 2021 earnings guidance) and consequently, a price to earnings ratio of circa 9X. In March, the company experienced record transaction volume of $199 million, up 34% on March 2020.

We believe that Earlypay’s acquisition of Skippr increases the quality of the firm’s earnings profile and should contribute to a higher valuation multiple of at least 12X earnings – this implies 33% 12 month upside to the current valuation.

Digital Transformation

Earlypay’s management has successfully digitally transformed the company from an old world financing business to a new world tech-enabled lender. The acquisition of Skippr’s technology platform has enabled the company to accelerate its onboarding capability of smaller sized clients from two weeks to 24 hours, and has allowed the company to service smaller businesses. Founded in 2016, Skippr is a proprietary online platform, providing invoice financing solutions to SME clients. Skippr has thus far been very successful, with over 90% of all new invoice financing clients onboarded and managed using the platform (up from 56% in the December quarter). As quoted in the Skippr acquisition presentation, an implied cost per acquired invoice financing client of $2,000 compares very favourably to Earlypay’s historical cost of acquisition of circa $20,000. Such efficiency gains will translate to an improvement in the bottom line and support our forecast increase in earnings.

Whilst Earlypay is far from the first tech enabled invoice financier, and faces challenges from Xero entering as an upstream provider, we believe that multiple smaller players can coexist. The addressable market size is vast and has sustained multiple participants for years. However, looking forward, we see Waddle (owned by Xero) as unlikely to continue supporting alternative accounting packages alongside Xero’s package (which captures ~50% of the market). With many ‘old school’ financers still operating in this space, we are confident in Earlypay’s ability to stay relevant. 

A Post-Covid Tailwind 

With government stimulus of the labour market having ended in March, many SMEs will require  additional capital and Earlypay’s invoice financing arm will benefit from the re-adjustment to pre-Covid conditions. The equipment finance arm of the business should benefit from near-term government infrastructure projects and asset write-offs. 

Knight in Invoice Financing Armour?

Earlypay has previously received acquisition offers from Scottish Pacific and Consolidated Operations Group (ASX:COG). COG offered scrip and cash valued at 48¢ a share. Scottish Pacific offered 60¢ (57¢ per share in cash and a 3¢ fully franked dividend). Whilst both deals fell through, COG retains a 17.4% ownership of Earlypay and may emerge as a suitor again.

Quip of the Quarter

“It is one of the common pieces of Wall Street experience that when the public goes stock mad and the market leaders are filled with the arrogance of prolonged success, such little things as high money rates or decreases in earnings or unraised dividends have no instant effect on the market — that is, on the state of mind of the speculating public. In the end, of course, all violations of the fundamental laws of economic and financial common sense are paid for.” – Edwin Lefevre (American journalist, writer and diplomat, best known for his novel, ‘Reminiscences of a Stock Operator’, which was inspired by legendary investor, Jesse Livermore)  

This statement was first published 98 years ago. 

It was appropriate back then, many times before then, many times up until today… and will be appropriate for many times to come. 

The cycle of greed and fear is the only certainty in investing and is core to human nature. 

We would preface this quote by noting that we do not believe the market as a whole is dramatically overvalued… COVID-19 vaccines are being successfully (for the most part) rolled out, monetary and fiscal stimulus efforts continue to be nothing short of extraordinary. That being said, it is not our job to decide whether the market is overvalued. Our only focus is on finding great businesses which can compound shareholders’ equity at a high rate.

However, it is clear that there are pockets of extreme euphoria in equity markets. 

Up until very recently, ‘value’ stocks were significantly underperforming ‘growth’ stocks. Obviously, this alone does not indicate euphoria. There are currently 4323 companies listed on the NASDAQ. Of those, 794 (18%) have a market capitalisation greater than 10X their trailing 1 year revenue (Finviz) – This statistic is simply outrageous.

The underperformance of value stocks compared to growth stocks

The rise of retail investors, some of whom are relying more on ‘hot tips’ and a plethora of online forums, adds fuel to the 10X revenue fire. 

SPACs, NFTs, Gamestop, Robinhood, Diamond Hands, Laser Eyes – such vernacular (and we could include much more) has only wandered into mainstream financial commentary relatively recently. Whilst we are all for progress and innovation, we worry that many people are not doing sufficient due diligence. Money is cheap… and sports betting is only legal in around half of US states. 

If you would like further details regarding our activities, we encourage you to follow us on Instagram and Twitter, where we share more regular bite-sized commentary. Email us at insufficientcapital@gmail.com

Insufficient Capital December Update

Happy New Year to our much appreciated subscribers. 2020 was a devastating year that we will all be happy to put behind us. The terrible events of the year, which continue to take the lives of the world’s most vulnerable, truly remind us of the relative unimportance of strong financial performance when one’s health is compromised. We hope that as the Covid-19 vaccine is gradually rolled out, that the world can return to some level or normality and that 2021 may be a fulfilling, healthy and prosperous year for you all.

Performance Figures

The portfolio rose +31.11% over the first half of the Australian financial year, outperforming the ASX200 performance of +13.69% by +17.42%. The top contributor during the half was Afterpay (APT:ASX)… yet again. There were no detractors during the half. The weighted average market capitalisation of our portfolio is $AU6.8 billion (up from $AU2.9 billion at H2 2020). The portfolio currently has 1.12% cash and is most heavily weighted to our ‘Structural Tailwinds’ strategy. 

Quarterly Portfolio Changes

There were two key portfolio changes during the half. These were: 

  1. Purchase of Redbubble (ASX:RBL)
  2. Purchase of BetMakers (ASX:BET) – Will be discussed in a future newsletter

Redbubble (RBL:ASX)

“Millions of new consumers have been exposed to online, many of them will continue to shop in this way. This is particularly true in the case of Redbubble because the content is created by hundreds of thousands of independent artists, it is ever-moving and always relevant. This is all made possible by an on-demand business model.” – Martin Hosking, Redbubble Co-Founder

What is Redbubble? 

Redbubble (founded in Melbourne in 2006) is a leading global marketplace selling products with independent artists’ designs printed onto them, delivered from 41 fulfillment locations across the world. Unlike other ASX-listed e-commerce businesses, only 6% of Redbubble’s revenue is recorded in Australia.  It is personally fulfilling to own part of a company which supports creativity. 

Redbubble’s unique structure allows artists to choose their own mark-up on base products, effectively controlling their ‘Artist Margin’. However, artists quickly discover the concept of price elasticity of demand and find a margin which maximises their revenue. As shown below, artists often copy each other’s Artist Margin and there is not a large price range. 

Redbubble’s product offering is uniquely priced to benefit both artists and consumers, with competition amongst the 500,000+ artists keeping prices reasonable, whilst allowing the artist to have complete control over their margin. In FY20, artist revenue was $AU67.4M (16.2% of the total sales of $AU416.3M) i.e. Redbubble collected revenue of $AU348.9M ($AU416.3M-$AU67.4M) net of artist revenue.

Pricing Example:

T-Shirt Base Price $AU15 (cost of manufacture plus Redbubble’s gross profit margin) > Artist’s Markup 20% (the markup set and edited by the artist) > Artist Margin $AU3 (T-Shirt Base Price multiplied by Artist’s Markup = margin collected by artist) > Retail Price $AU18 (T-Shirt Base Price + Artist Margin)

Popular products include T-shirts, stickers, phone cases, and most recently, masks. Masks have been sold through Redbubble since April and have been promoted to their own website category. The company is clearly taking advantage of a short term spike in demand for masks due to COVID-19. This is a key tailwind for Redbubble since masks are becoming as much of a fashion statement as jewellery or handbags. 

Whilst many may be quick to dismiss this surge as a fad based around Covid-19, we believe that the demand for face masks today is likely to seed future sales in other categories from returning consumers. Repeat sales already account for around 40% of Redbubble’s revenue. Redbubble is directing website space (masks are positioned prominently at the top of the website) and ad spending towards masks because that is currently the most in demand product category. It is not because the other areas of the business are struggling. 

TeePublic Acquisition

Redbubble’s proposition as a leading platform for artists to monetise their talents and for consumers to source a broadening range of unique products looks unlikely to change given its step-change in scale. Redbubble’s 2018 acquisition of TeePublic for $AU41M (at a multiple of 12.4X EBITDA) has gifted the company with further economies of scale through additional distribution partners.

Significant Founder Ownership

With technology firms trading at lofty valuations, one factor we look for to distinguish potential investments is a high level of founder ownership. At the end of FY20, Redbubble founder, Martin Hosking, held 18% of the company (although he recently reduced his holding to 16%). This high level of founder ownership is rare for an ASX-listed $AU1B+ capitalised company.

Founder-led S&P500 businesses have significantly outperformed their counterparts, driven by well-known consumer-centric brands such as Amazon and Facebook. In an Andreessen Horowitz blog, the firm outlines three reasons why founder-led businesses are the most attractive investment propositions. Founders typically have:  

  1. Comprehensive Knowledge: exhaustive understanding and passion for the product, customer, business and market 
  2. Moral Authority: willingness to abandon initial methods to challenge industry norms and continue to innovate 
  3. Total Commitment to the Long Term: willingness to undertake long term strategic investments, which will help build a company that lasts longer than the founder

Whilst he is no longer the CEO (and thus, Redbubble is not founder-led in the true sense of the phrase), we are confident that Martin Hosking is truly dedicated to the continued growth of Redbubble’s marketplace and has no desire to step away from the business he founded. 

Furthermore, we are confident in the ability of Redbubble’s newly appointed CEO, former SEEK executive (CEO of Asia Pacific and Americas), Michael Ilczynski. Michael and Redbubble entered into a non-recourse loan arrangement with a loan amount of $AU1,600,000. The loan plus $AU400,000 of Mr Ilczynski’s own funds will be used to purchase $AU2,000,000 of Redbubble shares on-market after the release of Redbubble’s H1 FY2021 results – such a financial commitment is far more than just a display of meek confidence for retail investors.

Positive Tailwinds

Participants in equity markets have recently realised that the triple digit revenue growth rates recorded by some e-commerce businesses cannot last forever (if you could double $0.01 every day for a month, you would have $5.4 million by the final day). Consequently, well-loved e-commerce stocks have sold off and traditional ‘old world’ value (e.g. banks, REITs, infrastructure) stocks have returned to vogue. 

That being said, once COVID-19 is (hopefully) a distant memory, Redbubble will undoubtedly retain a proportion of customers who have purchased masks through retargeting of its highly engaged site visitor base (16 mins 11 secs average daily time on website). The 16 minute average daily time on site is comparable to social networking companies. The average visitor spends more time on Redbubble than on Twitter (12 mins 47 secs) and Instagram (8 mins 49 secs). Other e-commerce businesses record much lower site engagement (e.g. Kogan – 3 mins 42 secs).

The other key (and more reliable) tailwind driving Redbubble’s sales growth is the COVID-induced structural shift towards e-commerce. Redbubble’s research reveals that COVID-19 has brought forward 10 years of online retail growth in just 3 months. Our other sources range from 5 to 12 years of growth over the period. People around the world have been forced to shop online and have realised that the experience is generally quick, simple and reliable.

Such digital shifts in behaviour are rarely reversed.

Customer growth has clocked in at 33%/annum over the last 5 years and has been achieved with pleasingly low costs of customer acquisition. Paid acquisition (Marketing) is astoundingly low, at only 10.2% of total revenue (Q1 2021, down from 11.4% over FY2020). In comparison, some of Redbubble’s peers spend up to 26% of revenue on marketing. Redbubble’s 511,000 artists are the company’s biggest voice, spreading the word about their online stores to bring customers to Redbubble free of charge – after all, it is in the artists’ best interests and represents a critical part of the company’s ‘flywheel effects’. 

FY2020 Results

Revenue contribution by product and region is outlined in ‘Q1 2021 Results’. At the end of FY20, Redbubble had 511,000 artists selling on the marketplace (+51% on FY19), with 6.8M unique customers (+30% on FY19) making at least one purchase. The 51% uplift in contributing artists is a critical vote of approval for the marketplace, with more and more artists seeing the benefit of selling through Redbubble to generate income. The uplift has also been supported by another key tailwind – the evolution of the unconventional ‘side-hustle’, whereby many people (particularly Gen Z and Millenials) aim to generate a secondary income source outside of their main day to day job. This secondary income helps to support increased debt burdens for young adults across the world, whilst education, healthcare and residential asset prices have continued to increase faster than wages growth.

The growth in contributing artists is critical to developing Redbubble’s ‘flywheel effects’. There are three core elements of the flywheel:

  1. Artists and Content 
  2. Loyal Customers
  3. Fulfilment and Operations

Redbubble’s capabilities, contributing artists and customers drive scalable 3rd party fulfilment across a global network of 41 fulfilment locations.

Real-Time Business Indicators

At Insufficient Capital, we monitor a myriad of real-time business indicators, particularly those relating to consumer behaviour. Trends give us a ‘feel’ for how a business is tracking long before its periodic quarterly/half-yearly updates to the market. We often use Alexa’s Site Overview tool to monitor global internet traffic and engagement for B2C firms. As at 15 October 2020, Redbubble’s website ranked #479 by global internet traffic and engagement (up from #732, 90 days previously – a phenomenal uplift in interest). There is a power law at play in site ranking, with each jump up the ranks becoming ever more difficult.

Q1 2021 Results

Redbubble’s Q1 results were nothing short of extraordinary, with the business effectively transitioning into rapidly increasing profitability (with high margins supported by well-targeted paid acquisition) as the business scales. The 43.7% gross profit margin recorded was the company’s best on record. 

At the end of Q4 2020, masks represented 27% of total sales but fell to 14% by the end of Q1 2021 (still high but significantly less). This drop in mask contribution makes the overall Q1 revenue growth of 116% even more extraordinary. The ANZ region (6% of gross transaction value) was a stand-out, with growth accelerating from 79% yoy in Q4 2020 to 124% yoy in Q1 2021.

We are confident that future quarters will benefit from further customer acquisition and increased customer loyalty, alongside increased optimisation of the fulfilment network. 

Valuation

We believe that Redbubble (RBL:ASX) is the last remaining pure e-commerce business on the ASX without a demanding ‘e-commerce valuation’.

The business currently (Q1 2021) has $AU85.4M of cash in hand and no debt. Management have not been in this cashed up position before and are still deciding on capital allocation, but have confirmed that they will not be returning capital to shareholders. We almost always support capital reinvestment policies and would generally prefer our portfolio companies to back themselves, just as we have backed them to allocate our capital. See below comparisons between Redbubble and other listed online marketplaces (although it is important to note that the comparables are not necessarily analogous). We believe that Redbubble’s ‘flywheel effects’ discussed above make it a superior (and more scalable) business to most of its comparables. Etsy is Redbubble’s closest peer and trades at a very rich 13.6X Forward EV/Sales. Kogan is the only peer trading at a significantly lower forward EV/Sales multiple than Redbubble, whilst eBay and Alibaba are the only peers trading at significantly lower forward EV/EBITDA multiples (however, both are growing slower than Redbubble). 

If Redbubble’s FY21 marketplace revenue growth is only 49%, we would be very surprised. We expect closer to 60% growth, building off the phenomenal 116% achieved in the first quarter. We would love to own Redbubble for 3+ years as the firm’s marketplace continues to attract artists and customers. 

We believe that Redbubble can grow revenues and EBITDA by 25%/annum over the next 5 years, benefitting from structural tailwinds and significant points of difference. We conservatively assume that there will be no further economies of scale contributing to margin expansion. In Q1 2021, gross margin expanded from 37.8% (Q1 2020) to 43.7%. Generally, on a sales multiple, we value Redbubble at 4X 2025 EV/Sales ($AU8.4 billion valuation = 5.7X today’s valuation as at 16 October 2020). On an EV/EBITDA multiple, we value Redbubble at 25X 2025 EV/EBITDA ($AU7.1 billion = 4.8X today’s valuation as at 16 October 2020). Both basic back-of-the-envelope valuations yield >35%/annum returns over 5 years.

What Could Go Wrong?

Whilst there are many risks to the success of the business, in the interests of attention span, we will discuss only litigation (a unique risk specific to Redbubble). Redbubble’s role as an intermediary for user-generated content exposes them to litigation risk as a result of intellectual property infringement. Currently, Redbubble will only review designs when someone submits a takedown notice. Another way Redbubble is addressing this issue is through their Partnership Program, which is a licensing agreement with rights holders. There are currently 67 content partnerships to promote the integrity of hosted content. 

There have been some favourable decisions including recently in the United States, a clear vote of approval for Redbubble’s business model and IP enforcement procedures and mitigation strategies. However, litigation regarding IP rights is inherently uncertain and laws in certain jurisdictions could change unfavourably.

Performance of our Corona Watchlist vs the ASX300 

In the depths of the coronavirus-triggered market correction, we put together a ‘Corona Watchlist’ of potential investments, which were discounted by the market panic. The watchlist’s 11 constituents were our key areas of research during the correction. Our Corona Watchlist and its performance as an equally weighted index are available here

Cadence Capital is the only Corona Watchlist member which has been added to our portfolio. We outlined our thesis for Cadence Capital in our end of financial year newsletter. As an index, the watchlist has outperformed the ASX300 by +34.6% since 31 March (2.17 times the ASX300 index return of 29.5%). The weighted average market capitalisation of the watchlist is >$AU20 billion. The best performing stock in the watchlist has been Resimac, a premier non-bank lender, which is up 260%. In contrast, Charter Hall Long WALE REIT, a diversified REIT, has been the worst performing stock in the watchlist, gaining only 5.2% since March 31 as uncertainty regarding the future of commercial property (offices and traditional retail stores in particular) continues to loom over the entire sector.

Two additional watchlists are available on our website: ‘Microcap Watchlist’ and ‘International Watchlist’. The International Watchlist has performed particularly well (+82.4% since March 31), outperforming its benchmark MSCI World Ex-Australia Index (+18.2% since March 31) by 4.5X. Interestingly, only 1 of the 20 stocks on the watchlist are down over the period: Bank of China. Alpha Bank and Unibail-Rodamco Westfield have also performed particularly poorly – all three are old world stocks in a brave and competitive new world. In contrast, Carvana and Tesla have both more than quadrupled in value since March 31 – new world autos winning an old world industry.

Quip of the Quarter

“Investing should be more like watching paint dry or watching grass grow. If you want excitement, take $800 and go to Las Vegas.” – Paul Samuelson, America’s first Nobel Prize winner in economics. 

There is no doubt that market sentiment has significantly shifted from the deep fear of the March lows (and, just like every other market crash, the world did not end) to whispers of euphoric greed recently. Whether capital is flowing into the latest hot IPO, Buy Now Pay Later or ‘cutting edge’ medical opportunity, there is no doubt that vast amounts of cheap capital are sloshing through the bourse. The dichotomy between hot and not has never been greater. Financials and REITs have languished for the past 6 months, whilst tech and healthcare dash through prior highs. In time, there will be a great many ‘A-Ha Moments’, with some traditional ‘value’ stocks trading much higher. We hope that we own a couple of these unloved opportunities, with some investors continuing to behave like restrictions have been lifted at The Bellagio. 

If you would like further details regarding our activities, we are always happy to discuss portfolio positions. We encourage you to follow us on Instagram and Twitter, where we share more regular bite-sized commentary. 

Insufficient Capital June Update

Welcome to our first end of financial year newsletter. 

We are very proud to have completed our first full year of operations, achieving significant outperformance (+24.96% vs ASX300 performance of -10.81%).

The structure of this newsletter will be: 

  1. Thank You
  2. Performance Figures
  3. Quarterly Portfolio Changes (including our favourite new opportunity)
  4. Performance of our Corona Watchlist vs the ASX300
  5. Podcast with Frazis Capital Partners
  6. Quip of the Financial Year

Thank You

When we launched our newsletter, we never anticipated the reception it has received. Primarily through word of mouth from you, our readers, we now connect with north of a thousand market participants – we’re always striving to improve our content, and hope that we can continue to share ideas with many more investors in the future.

Performance Figures

The portfolio rose +90.1% over the June quarter, outperforming the ASX300 performance of +16.5% by +73.6%. The top contributor during the quarter was Afterpay (APT:ASX). There were no detractors during the quarter. The weighted average market capitalisation of our portfolio is $2.9 billion. The portfolio currently has 8.6% cash and is most heavily weighted to our ‘Structural Tailwinds’ strategy. 

Quarterly Portfolio Changes

There were three major portfolio changes during the quarter. These were: 

  1. Full exit from Stanmore Coal Ltd (SMR:ASX)
  2. Partial sale of Afterpay Ltd (APT:ASX)
  3. Purchase of Cadence Capital Ltd (CDM:ASX)

Stanmore Coal Ltd (SMR:ASX)

On 2 April, Golden Investments Pte Ltd (Golden) announced an on-market offer of $1.00/share for SMR – their second bid for the company (having had an off-market $0.95/share offer rejected 13 months earlier). At the time of the announcement, Golden already owned 31.5% of SMR. Golden returned to SMR during the depths of coronavirus despair. We initially viewed the $1.00 bid as highly opportunistic when considering that Stanmore received a non-binding, indicative proposal from Winfield (a private group with experience in the Bowen Basin) in August 2019 for between $1.50 and $1.70/share. Whilst this unfortunately fell through, as discussed in our End of Year Update, the proposal indicated the potential value of the firm and the stock hit $1.50. Unfortunately, we did not take the exit opportunity.

It was clear that $1 (market capitalisation of A$270.4 million) was the highest price that would be achieved (although, there was also a 1 for 33 bonus issue). Muscled out during a time of opportunity, we exited the position. We first entered the position in November 2018. Overall, we made +5.8% from the investment (beating our ASX300 performance benchmark over the same period by +8.7%). Whilst it is always pleasing to beat the benchmark, there was no ‘warm fuzzy feeling’ in letting this company go. Golden has benefited from a highly opportunistic bid. 

Taking a glass half full view… whilst we lost out on one opportunistic coronavirus acquisition, we have benefited from another. The coronavirus provided an opportunity for EML Payments Ltd (EML:ASX) to renegotiate their acquisition of Prepaid Financial Services (Ireland) Ltd (PFS). PFS was fundamental to EML’s strategy of transitioning from a company deriving the majority of its revenue from gift cards, to one deriving the majority of its revenues from less cyclical general-purpose reloadable programs. The acquisition will allow EML to build a larger competitive moat around their business and better compete with $43 billion payments giant, Square (SQ:NYSE). On 31 March, EML completed the acquisition, paying A$252.3 million (reduced from the previously negotiated A$433.6 million). The renegotiated acquisition has ensured that EML remains in a position of fiscal strength throughout the current period of economic uncertainty, with in excess of A$125 million in net cash. The combined group has a total cash overhead expense rate averaging between A$5-6 million per month so there will be no need to raise capital at today’s heavily depressed valuation. We expect that EML will build its cash pile until it can justify another earnings-accretive acquisition. 

Afterpay Ltd (APT:ASX)

In May, we exited over half of our Afterpay position. We have often said that if nothing fundamentally changes within a business, there are very few reasons to trim its portfolio weight. There were a few key reasons why we trimmed this one:

  1. As we said in our last newsletter, three businesses will always make up at least 40% of the Insufficient Capital portfolio. Prior to the partial sale, Afterpay was our largest portfolio position and is still included in our top three positions after the sale. 
  2. The coronavirus has provided many new investment opportunities. Afterpay has recently surged to an all time high valuation, gaining well over 500% (yes, 500% with two zeroes) from its COVID-19 low. Was it oversold at a valuation of A$2.38 billion? Evidently. However, many businesses have recovered less strongly. Some of these are justifiably low. Others are not and we believe that capital should be allocated to these opportunities (many of these opportunities can be found in our various watchlists, available on the website). If Afterpay successfully executes in international markets and continues to execute domestically, we value the business at A$31 billion at the end of FY2024 (approximately 2X above today’s valuation). If we were not in a severe bear market, with many opportunities available and potential second-order impacts on unemployment, we would not have cut our position. We believe that over four years, opportunities to more than double our money are available elsewhere, with a lower risk profile.
  3. As we alluded to above, potential second-order impacts on unemployment (structural unemployment in particular) are yet to be seen. Afterpay provides short-term credit to its customers… even though it claims otherwise to some government regulators! If many of Afterpay’s customers remain unemployed for longer, they will spend less on discretionary goods and services. It is truly impossible to grasp the economic outcomes of today’s never-before-seen unemployment benefits, and ultimately, the higher future taxes required to fund them. The only (rather obvious) fact we know is that consumers with less after-tax income will spend less on discretionary items. With increased unemployment comes the risk of a higher default rate (Afterpay’s current default rate is 1.0%). The short duration loan book allows Afterpay to react swiftly to economic threats, quickly lowering spending limits, increasing credit checks and adjusting other variables. The firm is yet to face a full credit cycle. This uncertainty makes a very large position size uncomfortable. We like to sleep well at night.
  4. We are hearing the bullish case for Afterpay in media and investment channels more than ever before. Many people are using this bear market as an opportunity to invest for the first time. The bear market opportunity is compounded by global social distancing measures which promote staying at home to research the market and/or day-trade (most studies show that around 95% of day-traders lose capital… but that’s another story). The chart below reveals that US trading volumes have quadrupled since the start of the equities tumble. Many first-time investors buy well-known brands, such as Google, Apple, Facebook, Coca-Cola, Starbucks, Disney… and Afterpay. We believe that a vast amount of valuation-agnostic, short-term capital, is flowing into well-known brands such as Afterpay. When considering this extra variable, we are reminded of our 7th Ground Rule: “Be fearful about any investment being hyped in the media and market”

Despite the above points, we remain very positive on Afterpay’s business and management’s ability to execute. According to its 14 April announcement, March 2020 was Afterpay’s third largest underlying sales month on record, behind the Christmas months of November and December 2020. Q3 FY20 underlying sales increased 97% on Q3FY19. We would not be surprised if June 2020 is now Afterpay’s third largest underlying sales month. The business has only scratched the surface and we are very happy to retain a top three portfolio position. 

Cadence Capital Ltd (CDM:ASX)

We first discussed CDM and Listed Investment Companies (LICs) more broadly in our September 2019 newsletter. Since then, we have continued to monitor CDM, recently adding it to our Corona Watchlist and finally, our portfolio. This demonstrates the significant amount of work we put into analysing an idea before we add it to our portfolio. Whilst we generally prefer to choose the businesses we own, sometimes there are significant price dislocations which present opportunities in listed actively managed funds such as CDM. 

In September 2019, we wrote: we continue to evaluate Cadence’s portfolio and would not be surprised if it became a future position of ours… well well well. Fortunately, we did not purchase Cadence in September. At the end of September, Cadence’s post tax net tangible assets (NTA) was $1.048, whilst trading at $0.810 (a discount of 22.7%). As at 30 May 2020, post tax NTA was $0.979, whilst trading at $0.595 (a much steeper discount of 39.2%). The  end of June NTA and portfolio update will be released around 13 July. We believe that CDM’s portfolio has never looked better and is full of very high quality businesses that we love to own at the current discount. Our favourite Top 20 Cadence holdings (see entire list below) are: Resimac Group (RMC:ASX), EML Payments (EML:ASX), Macquarie Group (MQG:ASX), Facebook (FB:NASDAQ) and Credit Corp Group (CCP:ASX).

Cadence has moved from trading at a premium to NTA to trading at a discount to NTA over the last seven years. Does it surprise us? Not at all. Even Cadence’s founder/portfolio manager, Karl Siegling, said (at an annual general meeting) words to the effect of: “People will generally always sell at a discount and buy at a premium”. This was seen recently, when raw panic drove CDM down to $0.49 on 31 March 2020 despite net assets of $0.881/share (a huge discount of 44.4% made even more incredible when considering that the fund held $0.497/share of cash at the time, effectively valuing its equity holdings below 0). 

We’ve looked back through Cadence’s past newsletters to see how its premium/discount has changed since January 2013. The average discount over the entire period is 3.67%, while the average discount over the past two years is -21.58%. CDM’s current portfolio is full of well-known brands (aligned with Ground Rule No. 5) and is highly liquid. We believe that the extent of the current discount offers a tremendous opportunity when looking beneath the hood at Cadence’s individual portfolio constituents. 

Three catalysts for Cadence’s discount to NTA closing include: 

  1. Strong portfolio performance – Investors generally value a high-performing management team. For example, WAM Capital (WAM:ASX) trades at a 13% premium to NTA and has returned 15.7%/annum since August 1999, outperforming its benchmark by a phenomenal 8.0%/annum.
  2. Regular dividends – In a world where 0% returns are the new normal, Cadence and other LICs are a compelling investment proposition, particularly for retirees.
  3. Share buy-back schemes – These indicate to the market that the LIC’s board believes the fund is materially undervalued. They also effectively increase the LIC’s NTA whilst it is trading at a discount (see below for details regarding Cadence’s share buy-back).

We formed a view that Cadence satisfies all of our LIC investing Ground Rules (not to be confused with our general investing Ground Rules): 

  1. The LIC must have a significant discount to NTA 
  2. Investment strategy must align with our general investing Ground Rules
  3. Reasonable fee structure
  4. Strong track record (particularly during downturns)
  5. Management alignment and significant personal investment
  6. Share buy-back schemes are preferable  

Cadence’s founder has been buying shares nearly every day (this is not an exaggeration) and owns just under 8% of shares outstanding. Siegling backs himself. Recently, two other directors joined Siegling and purchased units. The company proceeded to announce an extension of the existing market share buy-back (on 20 May) of up to 10% of ordinary shares outstanding. This should increase the fund’s NTA per share whilst it trades at a discount as the portfolio is effectively rebought at a discount.. We believe that Cadence’s active capital management is prudent and value-accretive in this current environment. 

Cadence has a long history of dividend payments (see below) and has historically targeted a fully franked dividend yield of 6-8%/annum. Whilst trading at a discount, Cadence is not offering a discounted dividend reinvestment plan. This would have the opposite effect of a share buy-back, decreasing the fund’s NTA by issuing shares at a discount. Returning capital to investors in the form of dividends (with franking credits) is highly tax-effective for Australian investors. As yields continue to fall globally, CDM’s target yield is difficult to maintain (although the current discount is definitely helping!) 

Cadence is currently our favourite COVID-19 opportunity. The position has appreciated significantly since our purchase (outperforming the ASX300 by +3.5% over the quarter) but has trailed the rest of our portfolio. We believe that there is low downside risk for the position with so much fear already priced into the discount. Our simple calculation for the expected return of our investment in CDM is:

  1. Performance of underlying portfolio (NTA growth), which has been negatively impacted by COVID-19
  2. Reduction in discount to NTA as panic clears and greed returns (the panic-greed cycle in markets is almost as certain as death and taxes)

Performance of our Corona Watchlist vs the ASX300

Our Corona Watchlist and its performance as an equally weighted index are available here. Cadence is the only watchlist member which has been added to our actual portfolio. Whilst the other 10 constituents have not yet made the portfolio, they remain our favourite opportunities (and areas of research) during this downturn. As an index, the watchlist has outperformed the ASX300 by +11.7% since 1 April. The weighted average market capitalisation of the watchlist is $23.1 billion.

Podcast with Frazis Capital Partners

At the end of June, we recorded another podcast with Frazis Capital Partners on “Plug Power, Solaredge, and a market update”. The podcast (and all prior podcasts recorded with Frazis Capital) can be found here.

Quip of the Financial Year

“Wall Street never changes, the pockets change, the suckers change, the stocks change, but Wall Street never changes, because human nature never changes.” – Jesse Livermore (Livermore was the basis for the main character of ‘Reminiscences of a Stock Operator’)

COVID-19 was the defining moment of FY2020 for both society and financial markets. The virus may go down in history as the defining moment of the decade, bringing forward long-term structural shifts such as working from home. We believe that our world has materially changed, but we won’t know the full extent of the changes for many years. Looking into the future (and as a reflection of our commitment to being an active investment company) our FY2030 newsletter will likely reflect these structural changes… although we aren’t buying Zoom (NASDAQ:ZM) and Peloton (NASDAQ:PTON) just yet.

Livermore invested through the turn of the 20th Century, WWI and The Great Depression. One thing that has not been changed by COVID-19 is human nature. In the depths of despair, investors sell their shares at the worst possible time. Money market fund assets have ballooned by around 30% since the coronavirus struck down equity markets in March. The perpetual cycles of ‘Buy high/sell low’, ‘Greed/Fear’, ‘Exuberance/Panic’ were alive and well when Livermore made his first $5 bet on Chicago, Burlington and Quincy Railroad in 1892. 

If you would like further details regarding our activities, we are always happy to discuss portfolio positions. We encourage you to follow us on Instagram and Twitter, where we share more regular bite-sized commentary. 

Kind Regards,

Insufficient Capital

Insufficient Capital March Update

This, Too, Shall Pass…

Performance Figures

The portfolio fell -41.4% over the March quarter, underperforming the ASX300 performance of -24.3% by -17.1%. We are very disappointed but always endeavour to allocate capital (according to our Ground Rules) to avoid underperformance during the 81% of years that markets rise. The quarter was dominated by three very distinct months: January – a continuation of the 2019 equities bull run, February – coronavirus (COVID-19) strikes equity markets, March – global monetary and fiscal stimulus disastrously fails to address fears of a pandemic-induced recession. Track the virus on this live dashboard

History tells us not to panic. 

The graph below reveals that one month after the declaration of an epidemic, the average performance of the MSCI World Index is +0.44%, while 6 month average performance is +8.5%. COVID-19 has been far worse because of the increased role of China in the global economy (China now represents around 20% of worldwide GDP) and the proliferation of global trade. Should we have acted? Everyone’s hindsight is always 20/20 and whilst it would have been nice to buy businesses at lower valuations, selling them because of pandemics is not our strategy. We buy and hold businesses. Eventually, the virus will pass and most people will probably wish they’d bought the dip. We’ll find out in the coming months.

The last time equities significantly corrected occurred from October-December 2018. The S&P500 fell 17.5% from top to bottom while the ASX300 fell 12.1%. At the start of the 2018 correction, our three largest holdings were: Cooper Energy (COE:ASX), Starpharma (SPL:ASX) and Afterpay (APT:ASX). Our monthly performance over the three months was: -9.4%, -0.5%, -6.6%. Our monthly performance during the 4 months following the correction was: +4.1%, +5.3%, +7.7%, +8.6%. Over the 7-month period from the ASX300’s peak to peak, we outperformed the index by +10.1%. We suffered a larger drawdown but recovered much more strongly. We believe that our portfolio consists of high quality businesses without exposure to areas facing the greatest earnings risks: education, hospitality and travel. 

The top contributor during the quarter was Stanmore Coal (SMR:ASX) – note: SMR is subject to a takeover bid announced on the 2nd of April – while the largest detractor was EML Payments (EML:ASX). The weighted average market capitalisation of our portfolio is $1.6 billion. The fund is currently fully invested and most heavily weighted to our ‘Structural Tailwinds’ strategy. 

A More Consolidated Portfolio

Over the quarter, we consolidated the portfolio more heavily towards our best ideas. It is common for portfolio managers to run a side portfolio of a handful of their best ideas. Whilst this may seem like a lack of manager alignment, very few investors will pay fees to managers who buy <10 stocks (particularly if they are household names like Facebook, Microsoft and Visa). A consolidated portfolio is inherently more volatile since it is driven by the performance of its few constituents. However, as discussed in our first newsletter, the volatility (standard deviation) of a portfolio approaches its limit very quickly as new investments are added. The average portfolio of 10 varied investments is only around 20% more volatile than a portfolio of 100 investments… and as one’s investment timeframe extends, volatility becomes less important. Should an investor with a 20 year investment horizon really care where their portfolio lies on the graph below? After a 10 stock portfolio, probably not.

We confess to running a small side portfolio of our best three (often less) ideas. This portfolio has doubled since inception (1 July 2017) with few portfolio changes. Its performance occurred despite three drawdowns of over 15% during the period (including the current sell-off). Unfortunately, we decided to align the two portfolios just prior to the most recent (and largest) drawdown. 

In future, three businesses will make up at least 40% of the Insufficient Capital portfolio. Whilst there will be increased volatility, its performance will now closely mirror the side portfolio through good times… and highly disruptive viruses. The three core businesses will always satisfy our ‘Ground Rules’ and vigorous fundamental research. 

Warren Buffett said that “Diversification is protection against ignorance. It makes little sense if you know what you are doing.” In a couple of year’s time, we (and you) will see if we are ignorant or add alpha. There is nowhere to hide. The returns are there for all to see. In line with a handful of long-term investors, including Christopher Davis (See the ‘Quip of the Month’ at the end of this letter), we focus on absolute returns rather than worrying too much about portfolio volatility. 

We recently enjoyed recording another podcast with Frazis Capital Partners. Check out the discussion on the coronavirus and two Australian burns innovators (Polynovo and Avita) on desktop here and on iTunes here

SmartPay Holdings 

During the quarter, we initiated SmartPay (SMP:ASX) as one of our three core businesses. Smartpay is Australia and New Zealand’s largest full-service EFTPOS provider / merchant payments business. They have 35,000 EFTPOS terminals outstanding across over 25,000 merchants. It is the largest direct connector of terminals to Paymark, one of New Zealand’s two central electronic payment processing platforms (known as ‘switch providers’) and has a 20% market share of terminals in the country. The New Zealand business is mature ($18M of annual recurring revenue) whilst the Australian business is just getting started.

The Australian market opportunity is around 1 million terminals. Although SmartPay only has 0.4% of the Aussie terminal market (4000 terminals), it grew revenue by 32% last quarter. Australia’s big four banks are SmartPay’s key competition and continue to dominate national terminal count. They overcharge merchants, have terrible customer service, bear the cost of managing their own switches, lack focus on the business segment and have a poor reputation following the Australian banking royal commission. Tyro (TYR:ASX) has 45,000 terminals, while US payments giant, Square (SQ:NYSE), recently broke into the Australian market by targeting micro-merchants. 

Australian terminal and revenue growth:

In Australia, Smartpay initially offered merchants single-charge terminals with $35/month terminal rental (comparable to the New Zealand rental driven business model), running that product for 6 months. The business recently developed a zero charge terminal for the Australian market, with no monthly costs to the merchant and unlimited fee-free transactions – no scheme fees, interchange fees, acquirer fees, terminal rental fees. A 1.5% surcharge is added to each transaction and paid by the customer. The merchant does not pay anything but reserves the ability to transfer the customer’s cost to themself (e.g. for high spending and loyal customers). Smartpay offers free add on features including contactless payment, Alipay, WeChat cash out, tipping and MOTO. The key point of difference is cost. A typical Australian small business doing $25,000/month of transactions saves around $3,000/year using Smartpay over its competitors.

Smartpay avoids industries with prepayment risk such as travel agencies. They are very strong in small-medium enterprises in the hospitality industry. Large businesses demand lower prices from their payments provider. The banks focus on them with the hope of offering other financial products (e.g. debt facilities). Tyro now focuses on banking products rather than pure payments, using their banking licence. Smartpay is the only major operator with a complete focus on the payments business. No significant competitors (other than Square) have entered the market because there is a high moat. It takes at least 6 months of work to connect a new switch so switch providers tend to avoid talking to new entrants if they’re small operators.

Smartpay received a $70M offer from Verifone for its New Zealand business in November 2019. The New Zealand Commerce Commission’s decision on whether to approve the acquisition is due on 15 May. The $70M offer was double the market capitalisation of the entire company (including the Australian business) at the time. 

There could be a bidding war because all NZ transactions go through only two switch providers (Paymark – owned by Ingenico, Eftpos NZ – owned by Verifone). These market dynamics make Smartpay a very important asset for Ingenico. If the offer succeeds, Paymark would likely lose the significant 20% terminal share to Eftpos NZ since Verifone would change Smartpay’s switch provider from Paymark to Eftpos NZ post-acquisition. Ingenico paid $190M for Paymark in 2018 and risks losing a key revenue stream if Smartpay redirects transactions to the Verifone-owned switch provider.

Taking out the NZ business (presuming the $70M buyout goes through), the Australian business is currently valued at a measly $7.5M. Pre-COVID-19, it was on track to record $14M of annual recurring revenue this year. The current valuation appears very low when considering the high growth of the Australian business and its superior margin (over the NZ business). Smartpay intends to spend the sales proceeds on debt repayment, Australian growth and a significant dividend (or equivalent share buyback). Smartpay is currently valued at 5.2X consensus forward EV/EBITDA. However, this valuation will be even lower after the sale of the New Zealand business.

It is important to note that disruptive businesses like Tyro and Smartpay have flourished off the high fees and immobility of Australia’s big four banks. Smartpay could suffer continual margin erosion due to competition and ultimately have a low valuation multiple ascribed to it. 

Quip of the Month

“In a sense, we start with this mindset of building wealth over the long term. And in this way, we always say that we are absolute investors. We view it as if we are buying the entire business. We look for the returns to be driven by the cash the business produces over a long period of time.” – Christopher Davis (Davis Funds)

During times like these, it is easy to forget that long term returns are always sourced from future cash flows. Whilst the coronavirus will impact short-midterm cash flows, all portfolio businesses will make it out the other side (perhaps a little battered). 50% of our portfolio is debt-free with significant net cash. We are almost certain that none of our portfolio holdings will be forced to raise capital at their current low valuations (unlike shareholders in Webjet [WEB:ASX] who will bear the brunt of a recapitalisation 90% below its peak). Cash is king.

The eternal growth vs value debate is irrelevant to our portfolio construction. Faster growing companies (such as EML Payments) deserve higher valuation multiples and will return cash to investors as dividends at a later date. Slow growing companies (or those with mature assets) are already returning cash to investors (e.g. Stanmore Coal). There is always a fair price to pay for any company if its future cashflows can be forecasted.

If you would like further details regarding our activities, we are always happy to discuss portfolio positions. We encourage you to follow us on Instagram and Twitter, where we share more regular bite-sized commentary (recently, commentary has focused on the impact of the coronavirus on equity markets). 

We also recently published a coronavirus watchlist, where we highlight a handful of attractive businesses that we are looking at during this sell-off. Don’t get too excited – it is just a watchlist.

Remember to stay indoors, wash your hands and keep the most vulnerable of our community protected. #investfromhome

Kind Regards,

Insufficient Capital 

Insufficient Capital January Update

Performance Figures

The portfolio rose +9.67% over January, outperforming the ASX300 performance of +4.89% by +4.78%. We were very pleased with the result – a great start to the decade. Such strong index performance is incredibly hard to keep up with (let alone, outperform) when holding any cash or gold. We always endeavour to allocate all of our capital (according to Ground Rule #10) to avoid underperformance during strong months like January. However, we will only allocate capital when opportunities are sufficiently attractive to satisfy Ground Rule #12.

The top contributor during January was Afterpay while the largest detractor was Stanmore Coal. The weighted average market capitalisation of our portfolio is $3.3 billion. The fund currently holds 12% cash. 

At the end of January, the fund was most heavily weighted to our ‘Structural Tailwinds’ strategy. ‘Structural Tailwinds’ refers to areas of the economy which are growing at a faster rate than the national average economic growth rate. We note that these companies are not necessarily high-flying growth companies (for example, some non-bank lenders on PE ratios less than the market average fall under this strategy). Afterpay is the fund’s largest holding after its 30% appreciation over January and our decision to add to the position in November.

Going forward, we will release detailed newsletters every quarter (including a deep dive into a portfolio holding) and other updates when deemed appropriate. This will preserve a high level of quality content. 

(Another) Podcast with Frazis Capital

We recently thoroughly enjoyed recording another podcast with Frazis Capital Partners. Check out the discussion on “How We’re Different” on desktop here and on iTunes here. We provided details on Frazis Capital and its deep focus on the life sciences and technology in our last newsletter.

5 (more) Businesses on our CY2020 Watchlist

See the full CY2020 Watchlist on our website and analysis on the 5 other watchlist businesses at the end of our last newsletter.

Bank of Queensland (BOQ:ASX)Regional bank with fresh, proven management, driven to turn the bank around through competitiveness and technological advancement. Some painful writedowns may occur in the company’s troubled technology space before deploying newly raised capital to pivot the business back to growth.
 
Trades at 11.8X consensus forward PE multiple (consensus also presumes a -13% fall in EPS this year). All other major Australian banks trade at higher forward multiples: WBC at 13.0X, CBA at 17.4X, NAB at 12.2X, ANZ at 12.4X, BEN at 14.1X. Whilst the ‘big 4’ premiums could potentially be justified, BEN (another regional bank) appears unjustifiably expensive. We generally avoid speculating over potential M&A activity but believe that there is capacity for a regional bank deal.
Clover Corporation (CLV:ASX)Industrial manufacturer which utilises proprietary microencapsulation technology to deliver powders (both dairy and non-dairy) and oils (tuna). 
 
CLV’s microencapsulation technology (which removes any undesirable fishy odour or taste) gives the business an economic moat which supports long term compounding of capital (ROE is currently +24%). There are positive short-term tailwinds as Europe faces new DHA requirements.
 
At 24.7X consensus forward EV/EBITDA, +26% EBITDA growth and low leverage of 37% Debt/EBITDA, the business is attractively valued.
Resimac Group (RMC:ASX)Non-bank lender (which would fall under our ‘Structural Tailwinds’ strategy) with particular strength in residential mortgage backed securities (RMBS) origination. Specialising in prime mortgages, RMC carries far less default risk than other lenders.
 
At 11.6X consensus forward PE and strong double-digit growth in an industry where most businesses are struggling to grow their loanbook, RMC is a very attractive alternative to traditional bank stocks (which make up around 20% of the Australian market).
Universal Coal (UNV:ASX)South African thermal coal miner with a strong project pipeline and healthy balance sheet, paying a 12.5% yield (at a low payout ratio). 1.4X forward EV/EBITDA with positive earnings growth is a very low valuation even by thermal coal standards.
 
Eskom (state owned utility) has strong offtake contracts with UNV, with little risk that South Africa reduces its dependency on coal-fueled power generation over the midterm.
 
However, risks arise from recent scrutiny of Eskom’s supply contracts (and Eskom’s shaky financial stance), as well as general negative sentiment towards thermal coal. There is also a low proportion of revenue generated through exports, with reliance on South Africa’s economy.

Terracom (TER:ASX) recently took a 20% holding in the company in return for cash and scrip, at an implied valuation premium of roughly 50%. 
Viva Leisure (VVA:ASX)Leading Australian gym/health club operator with many membership options across 7 brands, as well as a history of earnings accretive acquisitions in strategically significant areas.
 
Viva’s gyms are well regarded in the industry, and its investments in technology are helping to develop a stronger brand with stickier customers than most gyms.
 
Valuation Risk?
Run rate guidance for $85M of revenue and $21M EBITDA (current market capitalisation is around $170M). Despite the company’s internally forecasted revenue growth rate of 77% (much of which is inorganic) and EBITDA growth rate of 97%, gyms often sell on EV/EBITDA multiples of <3X (around ⅓ of VVA’s current valuation) due to lack of loyalty and virtually non-existent customer satisfaction in the industry over the long term.

We have already dipped our toe into the watchlist, moving Clover Corporation from the watchlist to the portfolio during January as a small position. We like the area of the supply chain in which the business operates and believe it can generate alpha over the long-term. 

Quip of the Month

“We don’t have to be smarter than the rest. We have to be more disciplined than the rest.”– Warren Buffett

There has never been a better time to be a retail investor. In developed markets, strict laws and the proliferation of tech-driven financial products has given retail investors the tools to compete with any city-centre analyst or portfolio manager… yet retail investors almost always underperform the market. We covered one of the key reasons for this underperformance in our September newsletter when discussing why LICs often trade at discounts to net tangible assets. The clashing basic human emotions of greed and fear destroy returns for both retail and professional investors. In September, we revealed that a whopping 85.1% of actively managed funds have underperformed the S&P500 since the GFC while 91.6% have underperformed over a 15 year period. Unlike actively managed funds, retail investors do not face pressure to lock in performance fees by selling positions as they grow (reducing volatility, short-term downside risk… and returns). We discussed the difficulties facing actively managed funds to take a long-term view in our August newsletter.

There is only one reason to invest in a business – to make a profit. But there are many reasons to sell a business (with varying degrees of justifiability) – life’s needs; life’s wants; something materially impacts future earnings; everyone says you’re wrong; bearish broker reports; online investing forum advice; your partner’s cousin’s dad claims to know something he shouldn’t; tomorrow’s recession; divorce; and more and more. With vast amounts of information available now, more than ever before, and user-friendly trading platforms, it has never been more compelling to press the sell button. Investors continue to do so at the worst possible times.

As we said in our End of Year Special, we use fundamental analysis to buy and hold core portfolio businesses (we always think of our position as if we are owning the whole business rather than just some of its ‘stock’). In our opinion, it is critical to lock out all other noise in the market to avoid buying high and selling low, as well as general overtrading. Such discipline ensured that we never sold any of our top 3 portfolio performers during 2019: EML Payments, Afterpay, Pointsbet. These 3 investments continued to be our top performers in January, all appreciating over 10% during the month.Trading out of the market can be a very costly mistake when considering that the broader Australian index (most other major global indices have produced similar results) has generated a positive return in 81% of years since 1900, with an average gain of +13.2%/annum:

In fact, missing the top 5 best days on the Australian market over the last 20 years would have cost around 40% of return. The losing battle of market timing is further explained here

The S&P500 tells a very similar story. The graph below shows just a handful of reasons to sell equities since the GFC. The general result of doing so – disastrous.

Remaining disciplined is key. There must always be a set of compelling and justifiable reasons to press the sell button. 

If you would like further details regarding our activities, we are always happy to discuss portfolio positions. We encourage you to follow us on Instagram and Twitter, where we share more regular bite-sized commentary.

Kind Regards,

Insufficient Capital

End of Year Update

Happy Holidays to all our subscribers. Thank you for your support throughout our first half year – we greatly appreciate it and wish you many happy returns in the New Year. Hopefully we can help with some of those financial goals (but keeping the New Year gym membership resolution is not our responsibility). We encourage you to review our website, and follow us on Instagram and Twitter, where we share more regular bite-sized commentary.

Buckle up. This is an end of year special. The structure of this newsletter: 

  1. Performance figures
  2. Podcast with Frazis Capital
  3. What went wrong this past half year at Insufficient Capital 
  4. What went right this past half year at Insufficient Capital
  5. Stock focuses on Afterpay (APT:ASX) and Acrow Formwork (ACF:ASX)
  6. 5 stocks on our 2020 watchlist (we will provide details on 5 more watchlist stocks in the next newsletter)

Performance Figures

At the end of the December quarter, the fund was most heavily weighted to our ‘Structural Tailwinds’ strategy. ‘Structural Tailwinds’ refers to areas of the economy which are growing at a faster rate than the national average growth rate. Afterpay is our largest holding:

The portfolio rose +2.65% over the quarter, outperforming the ASX300 performance of -0.03% by +2.68%. The top contributor during the quarter was Acrow Formwork (ACF:ASX) while the largest detractor was Stanmore Coal (SMR:ASX). The top contributor during December was Stanmore Coal (SMR:ASX), while the largest detractor was Afterpay (APT:ASX). The fund currently holds 21% cash.

It was very pleasing to report outperformance of +10.93% over the half year, with outperformance over all months but October. This puts the portfolio well on track to achieve its outperformance target of +10%/annum above the ASX300. The cash position held over the half year averaged 22% while the position in gold (typically defensive) averaged 10%. Outperformance has been achieved through this relatively conservative exposure. The majority of our portfolio holdings have net cash on their balance sheets, ensuring the overall portfolio remains financially secure and nimble. This is particularly important during the current seemingly never-ending bull market, where the cost of domestic credit continues to break record lows. The fund continues to keep an eye on, but remains relatively indifferent to, macroeconomic conditions. 

Put simply, we find businesses that we like, and we buy them throughout the cycle. 

As far as the peak of the business cycle is concerned, Warren Buffett addresses the matter far better than we could:

“In the 20th Century, the United States endured two world wars and other traumatic and expensive military conflicts; the Depression; a dozen or so recessions and financial panics; oil shocks; a flu epidemic; and the resignation of a disgraced president. Yet the Dow (Jones Index) rose from 66 (points) to 11497 (points).”

Podcast with Frazis Capital

We recently thoroughly enjoyed recording a podcast with Frazis Capital Partners. Check out Part 1 (Part 2 will be in the next newsletter) of the discussion on growth opportunities and the software sell-off on desktop here and on iTunes here. Frazis Capital invests in a high conviction global portfolio focused on technology and the life sciences. The fund is one of the few investment vehicles in Australia focusing entirely on technology and the life sciences. Many value managers actively avoid these sectors. Michael (portfolio manager) has a deep understanding of the intricacies of the life sciences, having read chemistry at Oxford. Unlike Insufficient Capital, Frazis Capital is open for investment. The fund has posted a very strong performance of +29% this calendar year to date (as of 30 November).

What Went Wrong this Half Year at Insufficient Capital

Despite the significant outperformance recorded, there were a couple of disappointing outcomes throughout the half year. The largest stock-specific mistake concerned our largest position at the start of the half year, Stanmore Coal (SMR:ASX). There is always commodity price risk in miners. We entered the position, attracted by Stanmore’s strong margins, cashed up balance sheet (no debt), higher quality product, experienced management and project pipeline, concluding that the company could weather a coking coal price downturn.

The coking coal price has collapsed from a peak of $200/tonne in May 2019 to $140/tonne today:

Despite the price fall effectively halving Stanmore’s profit margin, the stock was supported well into September by a prospective buyout proposal from Winfield Group Investments for $1.50-$1.70/share. 

We formed the opinion that despite the falling coking coal price, other bidders were likely to emerge, attracted to the firm’s vast free cashflows and deleveraged balance sheet. Less than a year ago, Stanmore had received a buyout offer from Golden Investments, a potential rival bidder against Winfield. 

Stanmore Coal Equity:

At its peak, with the offer still in play, Stanmore had expanded to over 20% of the fund’s assets. Internally, we have a target valuation of around $1.90/share, with a belief that Stanmore is undervalued (a 40% discount to its larger peers) considering its high quality coking coal (rather than thermal coal) assets and net cash balance sheet. 

In short, the buyout fell through because the other major shareholders refused to cooperate (M Resources and Golden Investments) and no further bids were received. The stock corrected >30% to adjust for the lower coking coal price, costing us >6%. In hindsight, despite the fund’s internal valuation of $1.90/share, the position should have been halved to a circa 10% weighting. $1.50-$1.70 was the offer on the table and Insufficient Capital is not in the business of merger arbitrage. Lesson Learnt. 

A firm pillar of the Insufficient Capital investment methodology is buying and holding investments, effectively letting the market rebalance the portfolio over time (provided the investment thesis remains unchanged). For example, a portfolio of 10 stocks bought today with a 10% weighting in each stock, will have vastly different weightings if no changes are made over the ensuing 2-5 years. After such an extended period of time, it is quite likely that the largest 3 holdings account for over 60% of net assets, while the smallest 3 account for less than 15%. Our philosophy had not been tested by a prospective buyout. We were offered a multi-week opportunity to exit at an M&A elevated valuation after the coal price had collapsed… the benefits of hindsight.

It is now back to business as usual. Stanmore will likely generate over $100M of EBITDA this financial year and EPS of circa $0.25, with earnings supported by continued global stimulus driving steel-making across Asia. The market values Stanmore at a forward PE of 4X and EV/EBITDA of 1.6X. The firm continues to trade at a 40% discount to a basket of its peers despite its superior quality coal and substantial cash position. The main reasoning behind the ‘Net Cash Miners’ strategy is continual investment throughout the cycle (particularly when commodity prices are depressed) and resilience to the threats of cyclical downturns. Cash also facilitates asset purchases at heavily depressed valuations. It is important to remember that Stanmore transformed a $1 asset purchase (when coking coal prices were low in 2015) into a $300M company.

The other key mistake made during the half year concerned general issues around position sizing. As described above, setting and forgetting a portfolio for a long period will always show a portfolio manager which companies are performing well because “In the short run, the market is a voting machine but in the long run, it is a weighing machine” (Benjamin Graham). Going forward, we will be much stricter on initiating every new position at a similar size (weighted relative to risk), resisting the urge to add to positions or transact without high conviction. At the moment, Insufficient Capital transacts around twice per month (this is quite low but could be decreased considering our ‘buy and hold’ mentality). 

What Went Right this Half Year at Insufficient Capital

Consolidating the fund’s overall strategy in April has been successful thus far. Paying a fair price for great core businesses through fundamental analysis has been the key to success. Analysing businesses’ future cashflows and future cashflows alone is what we do best. All other methods of valuation are background noise.

The top three contributors which account for approximately all of the fund’s performance over the half year are: 

  • EML Payments (+6.5%)
  • Afterpay (+3.6%) 
  • Pointsbet (+2.5%)

Whilst a high level of consolidation amongst performance contributors is expected for a high conviction portfolio, underperforming holdings in the portfolio must have their time in the sun. This is the only way to sustain long term outperformance without high volatility since outperforming holdings which continue to outperform will increase in portfolio weighting, and thus, potential drawdown. We believe that Acrow Formwork (see further analysis below) will be the most likely outperformer out of the fund’s previously underperforming holdings.

Stock Focus: Afterpay (APT:ASX)

Afterpay is one of the most widely discussed stocks on the Australian market. In fact, the fund’s sources reveal that it has become very topical amongst US investment circles (particularly after US technology fund, Coatue Management, invested $200M in November). It is difficult to add a different perspective to Afterpay but hopefully the commentary below adds value to the overall picture. Some of our prior commentary on Afterpay can be found in the August newsletter.

The fund believes this is an excellent time to own Afterpay stock, with exponentially increasing spend/customer and superb execution in the US, where the overall customer count is now comparable to Australia. The August newsletter highlighted the relationship between domestic purchasing frequency and time since joining Afterpay. This year’s annual results (reported 28 August) revealed that customers for 3+ years purchased through Afterpay around 20X/annum, 2+ years around 10X/annum and 1+ years around 4X/annum. Those customer cohorts now respectively spend 22X/annum, 14X/annum and 7X/annum.

It is important to remember that nearly all of the circa 3 million US customers fall into the 7X/annum category (along with the >500K UK customers added since launch 8 months ago). If the overseas customers follow Australian consumer behaviour, total purchases across the entire business could more than double over the next 2 years. That is without any further customer acquisition or increased domestic purchasing frequency.

Afterpay is currently trading at around 15X forward EV/Sales, towards the lower end of its historical trading range (however, as described above, we place little value on historical trading ranges). In the past, Afterpay has traded between 10X forward EV/Sales and 30X forward EV/Sales (30X usually prior to the announcement of annual results in August). By the end of this financial year (June 30, 2020), Afterpay will be far more established in the US and UK. Strong underlying sales growth is again expected over this financial year (underlying sales grew +140% last financial year), driven by customer growth in the US and UK along with increases in spend/customer across all markets… the black revenue line should significantly leg up again come next year:

November’s sales figures boded very well for FY2020 revenue, driven by record sales on Black Friday and Cyber Monday. The $1B of sales processed by Afterpay was a monthly record for the company. Sales of $160M over Black Friday and Cyber Monday were up +160% compared to last year. Afterpay also attracted over 140,000 new customers over the 2 days. The business is on track to process over $9B of sales this financial year (FY2019 recorded $5.2B of sales).

Gross Merchandise Volume (GMV – effectively equivalent to total underlying sales for Afterpay) and the company’s market capitalisation have both increased significantly over the last 2 years:

We have tracked interesting measures for Afterpay’s development: Instagram follower growth, google trends data and iOS app ratings. The graph below illustrates the growth of the google search term, “Afterpay”, compared to its 3 largest US competitors. Afterpay is clearly gaining superb traction in the US, with google search frequency increasing about 5X over the last 12 months:

Despite the stock appreciating over 5X since our first entry, we have never been more excited about Afterpay’s future prospects. We are confident that it will still be our largest holding at the end of the financial year. 

Stock Focus: Acrow Formwork (ACF:ASX)

Acrow Formwork is typical of Insufficient Capital’s ‘Deep Value’ strategy. The companies in this category are unloved, often relatively unknown operating businesses that produce strong cashflows. The thesis behind Insufficient Capital’s initial investment in Acrow can be found in an earlier newsletter

Acrow’s acquisition of Uni-span (a Queensland formwork, industrial scaffolding and labour hire company) for $21.25M (4.4X FY19 EBITDA) is a game-changer for the little-known $70M microcap. Uni-span primarily serves the typically defensive civil infrastructure market. The acquisition immediately adds 22% to EPS (from 4.36cps to 5.31cps) before any potential synergies are realised. 

Potential synergies include revenue synergies from complementary products and services, as well as integration synergies with regard to yard consolidation, staff and other general expenses. Such synergies support earnings growth over the mid-term. With the business trading at 6.7X forward PE and 4.6X forward EBITDA, there is not a lot of growth priced in. The new consolidated group has already experienced early success with a 6-9 month $2.75M contract to provide formwork propping solutions for Sun Metals Zinc Refinery.

A particularly exciting part of Uni-span is its exclusive arrangement with ULMA (a leading Spanish manufacturer and supplier of formwork, shoring and temporary scaffolding systems). The newly consolidated firm recently signed a 3 year contract extension with ULMA, which now includes product distribution in New Zealand. Steve Boland, CEO of Acrow, stated that “We are encouraged by the similar dynamics being experienced in the New Zealand civil infrastructure construction market as those experienced in the Australian market at present. Early indications suggest that the marketing and supply of Acrow/ULMA formwork products into New Zealand will be well received by the market.” Uni-span also has a specific style of equipment which is key to tunneling-style work, further expanding the product offering of the combined business. 

Acrow financed the acquisition with its Westpac facility, maintaining relatively conservative gearing of 34% net debt/equity.

In 2012, Warren Buffett purchased a WA crane company. In 2017, the company generated $6.15M of profit on revenues of $150M. It was a classic old-school Buffett investment… a founder-led, capital intensive, reliably profitable firm. Other construction companies owned by Berkshire Hathaway include: Acme Brick Company, Benjamin Moore and Co, Cavalier Homes, Clayton Homes, International Metalworking Companies, Johns Manville and Shaw Industries. Such businesses are not particularly glamorous but have relatively reliable cashflows and are easily valued on traditional metrics.

Insufficient Capital values Acrow Formwork at 7X forward EV/EBITDA (50% above the firm’s current valuation) based on discounted cash flow analysis and peer comparison.

5 Businesses on our CY2020 Watchlist

STOCKWHY WE’RE WATCHING
Bapcor (BAP:ASX)Australasia’s largest aftermarket auto supplier/service provider (parts, accessories, equipment) with steady revenue, profit and dividend growth across its umbrella of brands. 5 year CAGR: Revenue +36% NPAT +42%, EPS +25%, DPS +18%

Expansion to Asia (currently 5 Burson Auto Parts stores in Thailand) gives Bapcor access to far larger markets with the hope of replicating Australian success.

At 18.1x consensus forward PE and 12x forward EV/EBITDA, the business is attractive if high single-digit growth can be achieved despite the underlying low economic growth environment.
Carvana (CVNA:NYSE)Sells used cars online and provides finance for them. This means that they don’t have the typical costs and overheads of a traditional dealership. Cars are then delivered to your door. i.e. lower cost of doing business and more consumer friendly than traditional dealerships.

Business has grown revenue organically at >100% pa but remains loss-making for now. Currently 0.4% market share in a highly fragmented market (with no single firm holding more than 5% of the market). If the business continues to demonstrate its value to consumers, market share could significantly expand.
Sandfire Resources (SFR:ASX)Copper-gold producer valued attractively at a compelling EV/EBITDA of 2.5x with a strong net cash balance (about 25% of market capitalisation). We believe market has placed too much emphasis on its short mine life (~3 years) at its flagship DeGrussa project.

SFR has made numerous investments in junior explorers, and a recent acquisition of MOD Resources, which we think should provide adequate project pipeline. That said, we need to be convinced of management’s ability to allocate capital before making an investment.
Synlait Milk (SM1:ASX)With strong ties to A2 Milk (A2M), SM1 develops its assets to deliver quality New Zealand dairy products, with a particular focus on the high growth infant formula market. 
 
Exclusive supply rights to A2M, 5 year minimum supply agreement signed in 2018, A2M owns 17.4% of SM1.
 
Question marks surrounding the longevity of SE Asian demand for Australian infant formula and dairy products, particularly after the Chinese acquisition of Bellamy’s in September. 
 
17.2X forward PE and 10.1X forward EV/EBITDA with low double digit earnings growth is very attractive.
Xero (XRO:ASX)We were most attracted to XRO when we first bought Afterpay in late 2017. At the time, we believed we had enough exposure to unprofitable high growth firms in the portfolio. 2 years have passed and we clearly made the wrong decision (the company’s valuation has nearly tripled).
 
XRO’s simple accounting software continues to successfully expand across the US and UK, with ever-increasing economies of scale (as is typical of SAAS businesses). It is a high quality, net cash business, benefiting from the broader move towards accounting simplification.
 
At a consensus 2021 PE of 180X and EV/EBITDA of 55X with top line growth of circa +35% and earnings growth around +60%, we believe XRO will do well but struggle to see a continuation of past returns with the possibility of valuation multiple compression… famous last words. 

We hope to record strong performance throughout the second half of the Australian financial year and look forward to keeping our subscribers updated. The founder has their entire net worth invested in this strategy. If you would like further details regarding our activities, we are always happy to discuss portfolio positions. 

Best Wishes for 2020 and a very Happy New Year.

Insufficient Capital April Update

Welcome to the first monthly newsletter for “Insufficient Capital”, the name applied to a long-only equities portfolio. The name applied to the fund is a self-deprecating jab at the fund’s relatively small pool of capital. The newsletters aim to analyse the portfolio as well as general market/economic conditions.

About the Portfolio Manager

The portfolio manager is studying a degree in Civil Engineering (Hons) and Commerce (Finance) at UNSW. Some of the harsh lessons learnt through past investments manifest in the “Ground Rules” available here.

During the month of April, Insufficient Capital appreciated +8.56% compared to the ASX300 Performance of +2.43%. The rationality behind benchmarking against the ASX300 will be explained at the end of this newsletter. The greatest performance contributor was Starpharma Holdings (SPL:ASX) while the largest detractor was Aurelia Metals (AMI:ASX).

As the first monthly newsletter, it is pertinent to set up the Ground Rules for the fund, the disclaimer being that the fund reserves the right to break the rules in special circumstances. Any amendment to the Ground Rules will be noted in future letters.

Our Ground Rules are available here.

These letters will discuss specific stocks, typically portfolio positions, and topics relevant to investing. When investing, nearly all learnings occur when money is lost so it is fitting in this first newsletter to discuss the largest monthly detractor: Aurelia Metals.

Aurelia Metals

Aurelia fell around 16% during the month, primarily due to a disappointing quarterly result. Gold production of 23,323oz was down due to the underperformance of gold grades (less gold was in the ore mined than expected) while the all-in sustaining cost (AISC) was $1302/oz, up significantly from $733/oz recorded last quarter. However, the gold price achieved of $1821/oz demonstrates the significant margin Aurelia has as one of the lowest cost Australian gold producers. Cash conversion was strong, with Aurelia’s quarterly sales revenue of $67m resulting in net site operating cashflow of $25.6m. Net cash increased marginally from $107.9m to $108.6m. Although underwhelming, Aurelia is taking the measures required to continue doing what it does best – low cost gold production.

Concerns have been raised over Aurelia’s mine life, dampening the EV/EBITDA multiple applied to the company. The company’s Hera asset has a mine life of 4 years and contains 7 ore bodies. The current program for the asset is focused on near term drilling. After Hera, Aurelia will begin mining Nymagee which also has a life of 4 years. Aurelia’s Great Cobar asset has a potential mine life of 6 years and will add significant resources and reserves. Aurelia’s strong free cashflow from operations will likely enable it to fund Nymagee and Great Cobar without taking on debt.

A note on Aurelia’s hedging

In the past, hedging was required by lenders. The company’s healthy balance sheet has allowed hedging to run off, leaving the firm more exposed to movements in the gold price. When prices are above $1600-$1700/oz, Aurelia has stated they will hedge up to 50% of their gold production. This was reiterated on a private call the portfolio manager had with the CFO.

Why does Insufficient Capital hold Aurelia?

Insufficient Capital has a pessimistic outlook for the Australian economy over the short-to-midterm due to persistent levels of household debt (190% debt to income ratio is now the highest in the world), the increasing cost of credit impacting consumer spending and the wealth effect of falling house prices in Australia’s two major urban centres. It should be noted that Australia recently fell into a per capita recession for the first time since 2006, meaning that the economy relied on population growth to support the economy.

Gold is famously a poor long-term investment but performs well during challenging times and volatility due to its underlying value. Investment in a low cost gold miner like Aurelia effectively combines two hedges:

  1. Gold as a store of value
  2. Owning a business with high free cashflow from operations and a strong balance sheet (See Ground Rules 1 and 4)

Aurelia is valued at a favourable consensus forward EV/EBITDA multiple of 2.8X for the year ending June 30 2019. This compares to a global peer average of 9.4X (seekingalpha). If Aurelia continues to increase its cash balance rather than engage in capital expenditure, its EV/EBITDA multiple would likely continue to fall. It is significant to note Aurelia’s low EBITDA multiple despite a 3350% valuation gain since 2015 – debt-financing works wonders.

Aurelia recently disclosed it is in preliminary discussions regarding the potential acquisition of CSA Mines (a copper mine also in the Cobar region) from Glencore. The fund believes that this is an exciting earnings-accretive opportunity and efficient use of Aurelia’s substantial cash position.

Aurelia has made an astounding transition from carrying significant levels of debt to net cash within 4 years. This has led some to believe that new investors are late to the party. The fund does not believe the expected return is as high as it was in FY15, but the risk profile is now lower.

Benchmarking against the ASX300

Insufficient Capital will be benchmarking performance against the ASX300 index because there will be a strong portfolio weighting towards its constituents. Most companies with strong balance sheets and low leverage are towards the bigger end of town. Sometimes the fund will find companies which have lower capitalisations that are viable investments if they meet the criteria outlined in the Ground Rules (for example, Acrow Formwork – ACF:ASX). These will often be traditional operating businesses in retail, construction and broader industrials.

During the month, Warren Buffet’s perhaps most famous adage strongly resonated:

“Be Fearful when Others are Greedy and Greedy when Others are Fearful.”

This rings true for both the largest contributor and detractor for the month. Investments trading off fear often generate the greatest alpha opportunities. In this month’s positive case, the contrarian view is that Stanmore Coal offers great value with fears that coal has peaked pushing EV/EBITDA multiples very low. On the flip side, when staring into the abyss (for Insufficient Capital, this takes the form of a large red number), it is pertinent to recall the thesis behind the investment and remind oneself that the market is often irrational in the short term but a great weighing machine in the long term.

We look forward to future correspondence and would appreciate any constructive criticism going forward.

Yours Truly,

Insufficient Capital

Insufficient Capital May Update

Insufficient Capital fell 5.67% over April, compared to the ASX300 gain of 1.18%. The top contributor was Stanmore Coal, while the largest detractor was Aurelia Metals. On a rolling 12-month basis, Insufficient Capital has significantly outperformed the ASX300.

Acrow Formwork and Scaffolding (ACF:ASX)

During May, Insufficient Capital entered a substantial position in Acrow. Despite sitting well outside our preferred investment field of the ASX300 (market capitalization is $56m), the firm satisfies our investing Ground Rules* and we believe it will be a long-term compounder for the fund. Acrow has seven locations Australia-wide and employs around 150 staff. Although Acrow was a terrible performer this month, we never profess an ability to pick the bottom in individual stocks. We prefer to spend time in good companies rather than attempt to time them.

Acrow has a strong focus on civil infrastructure projects such as the Harwood Bridge upgrade over the Clarence river (Client: NSW & Federal Governments) and the Civic Centre Flytower Façade Refurbishment (Client: City of Mount Gambier). With its focus on infrastructure, Acrow’s revenue is highly defensive and the company can grow countercyclically as infrastructure spending increases to stimulate the economy during downturns. We are excited about Acrow’s prospects due to a plethora of both state and federal election infrastructure commitments following recent elections:

Residential Construction Fears
It is difficult to find an Australian monthly investment newsletter which does not touch upon the woes of domestic residential construction. Residential construction work has declined 17.7% from its peak in mid-2016 (Business Insider). This could have explained why Acrow has fallen 40% over the last 6 months until we took a look at the proportion of Acrow’s revenue derived from residential construction.

In fact, only 12% of Acrow’s revenue is linked to residential construction. Furthermore, revenue derived from residential construction grew from $3.7m in 2HY18 to $4.2m in 1HY19. At Insufficient Capital, we are always grateful for fear (in this case, regarding residential construction) because of the opportunities that often arise from it.

Natform
Natform was acquired by Acrow effective September 1, 2018 for around 2X trailing 12 month EBITDA of $3.8m. Management is pleased with the integration. It is clear that there are strong synergies between the two businesses. Natform recently won its first Victorian contract for a few years with some help from Acrow. On the flipside, Acrow is targeting larger players in NSW formwork through Natform connections. Management also estimates that around half of Natform’s current job pipeline have a client connection to Acrow with the potential for an integrated product offering.

Management has stated that it is open to further acquisitions along with organic growth. We support this trajectory (but will analyse future potential acquisitions as they arise). We see value in Acrow if the firm continues to purchase businesses with synergies at low multiples of EBITDA. These will likely be revalued by the market at Acrow’s EBITDA multiple (currently 3.9X), effectively increasing the market value of the acquisitions. During 1HY19, Acrow made operating cash profit of $5.5m. Debt currently stands at $2.5m (the company has a $15m Westpac facility). At this late point in the business cycle, we would prefer Acrow fund acquisitions through free cashflow rather than through the facility.

Acrow’s roll up strategy is reminiscent of Greencross (GXL:ASX), an operator of vet clinics and pet stores throughout Australia which was recently bought out and delisted. Greencross similarly purchased businesses at low multiples (family-owned pet stores, private vet clinics etc), the cashflows of which were then valued at Greencross’ higher market-applied multiple. This proved to be very lucrative for investors. Of course, roll up strategy alone does not add any value. However, Acrow has indicated that its acquisitions should result in strategic synergies, pulling out pooled costs and promoting integrated product offerings.

Margin Growth
Acrow has achieved a remarkable improvement in EBITDA margin over the last 4 years due to its extensive range of formwork and scaffolding solutions, as well as superior overall service. Acrow is also introducing in-house engineering expertise to increase its service quality and product offering.

Valuation
Acrow is valued as if it is highly leveraged to Australia’s residential construction headwinds. The firm has a 6/2019E free cashflow yield over 20% with estimated double-digit earnings growth over the next two years. A PEG ratio (PE ratio divided by forecast EPS growth) of around 1 is generally viewed as reasonable, while high quality companies or those with defensive cashflows often have a ratio over 1. In comparison, Acrow’s PEG ratio is around 0.5 – an opportunity in a fearful market.

Yield
At Insufficient Capital, we do not particularly care for a dividend yield and almost always prefer our holdings invest their capital rather than return it to shareholders. If suitable investments are unavailable, we would generally prefer our holdings to engage in share buybacks rather than pay a dividend so as to marginally increase our ownership of the company over time.

However, if a holding offers a dividend reinvestment plan (DRIP) at a discount to its recent share price, we will take it up 99% of the time according to Ground Rule* #9. In Acrow’s case, the DRIP is at a 2.5% discount. The annual 6.3% yield represents a very low payout ratio to allow for dividend increases over time (we plan on reinvesting all dividends with the DRIP).

Cooper Energy (COE:ASX)

Cooper is a position which has nearly played out – a great example of a typical investment for the fund. Cooper generates revenue from the discovery, commercialisation and sale of gas to south-east Australia and low-cost Cooper Basin oil production. The company currently produces around 6PJ of gas per annum from the Otway Basin (mostly from the Casino Henry project).

Sole
Cooper purchased the ‘Sole’ gas project from Santos on 1 Jan 2017, and in late 2017 completed a $400m financing round involving $135m of equity and $265m debt, from ANZ bank and Natixis. The Sole gas field will supply 24PJ of gas per annum from June 2019 and has a growing portfolio of take-or-pay gas supply contracts, with customers including AGL Energy, Alinta Energy, Energy Australia and O-I Australia. These contracts reduce Cooper’s exposure to future gas price volatility (although we expect gas prices to increase, we still prefer to reduce exposure to commodity price risk). The project was 98% complete as at 31 March 2019 with capital expenditure incurred on the project to that date by the company totalling $314m. Below represents the increase from 6PJ (at Casino Henry) in 2019 to around 30PJ (upon commencement at Sole) throughout the 2020s.

Manta
There is also considerable upside with the development of Cooper’s Manta project which would nearly double production from FY2024. Although there would be financing costs accrued, the lion’s share of value would accrue to existing shareholders.

Domestic Gas Pricing
As gas prices are higher overseas, there is likely to be a shortage in the populous eastern states. Most gas is converted from coal seam gas and exported as LNG. At the time of project approval, the government rejected proposals that mandated a proportion of gas to be sold domestically. Cheap gas produced in Victoria is now being diverted to Queensland, where it is sold at a premium offshore. Currently, two thirds of gas produced is sold offshore. There is limited pipeline competition which adds further barriers to a competitive local gas market. This supports domestic gas prices with demand far outstripping supply. Even though Cooper is protected from gas price risk by its take-or-pay contracts over the majority of future production, it is a pleasant bonus that prices for uncontracted gas are supported by a strong imbalance between demand and supply.

Valuation
When we entered the position, Cooper had a market capitalisation of $470m and a significant cash position. This cash has now been depleted to finance the development of Sole while the market capitalisation has risen to $867m. 2020 EBITDA is forecast to be $178m (up from $37m in 2019). At purchase, Cooper had a 2020 forward EV/EBITDA of under 2X. This multiple has since risen to 4.8X.

COE:AU

Since Cooper will likely continue to achieve EBITDA of around $180m throughout most of the 2020s (excluding any potential contribution from Manta), we expect the market to value Cooper at a utility-like 8-10X EBITDA, which would imply a further 1.7-2X increase in value. Few investors are willing to invest on three-five-year time frames for future earnings potential. Some examples of comparable past investment opportunities would be Beach Energy and Oil Search pre-production. Insufficient Capital took on Cooper’s development risk and has been rewarded, however we believe there will be further rewards for investors who wait until the market fully appreciates annuity-style earnings. We will review and potentially exit the position once earnings begin to flow from Sole later in 2019.

Quip of the Month

“An investment operation is one which, upon thorough analysis, promises safety of principal and an adequate return. Operations not meeting these requirements are speculative” (Benjamin Graham – The Intelligent Investor).

When reviewing our investments in Cooper and Acrow, Graham’s emphasis on the conditions for investment over speculation came to mind. When investing, we look at the business qualitatively before estimating future cashflows and then discounting them. Short-term fluctuations in valuation are irrelevant to our investment style.

We are confident in the long-term safety of Acrow as infrastructure spending grows with the Australian economy, while the firm’s valuation at a low multiple of cashflows supports an (hopefully) adequate return. Although it is generally risky to expose oneself to the Australian economy, we believe Acrow’s downside risks are on balance outweighed by the upside potential presented by a low valuation.

If subscribers would like further details on Acrow Formwork and Cooper Energy, we are more than happy to answer any questions.

Kind Regards,
Insufficient Capital

Insufficient Capital June Update

A Change in Our Reporting

Going forward, we will only report performance when we deem it to be significant to the fund. We will report industry weightings quarterly. At the end of the June quarter, our portfolio was most heavily weighted to Australia’s energy industry (particularly towards coal and natural gas):

On a monthly basis, we will report net equities exposure, the largest contributor, the largest detractor, monthly ASX300 performance and any key changes to the portfolio. At June end, net equities exposure was 87%. The largest contributor was Stanmore Coal, while the largest detractor was Aurelia Metals. The ASX300 appreciated 3.41% over June. We generally like to hold a minimal cash position (See investing Ground Rule* #10) due to the long term powers of capitalism but believe current market and economic conditions present an extremely challenging environment to achieve our desired annual return target (See investing Ground Rule* #12) without taking on excessive risk. We believe that future opportunities will yield better risk/return profiles.

As a high conviction fund, Insufficient Capital has a more volatile return profile than the benchmark due to its larger position sizes. We stress that high volatility does not indicate that the fund is taking on excessive risk. Abstaining from monthly performance reporting will ensure that the fund’s long-term positioning is not misrepresented. We do not engage in proprietary trading or other short-term strategies.

Afterpay Touch Group (APT:ASX)

Our long-term position in buy now, pay later juggernaut, Afterpay (APT:ASX), recently corrected 25% over compliance fears after Austrac ordered the appointment of an external auditor to assess its AML/CTF compliance. We believe this was an overreaction since the mere appointment of an external auditor should not result in a more than $1.5B destruction of firm value. This significantly impacted our performance over the short term (the stock has since recovered around 20%).

More recently, Visa’s announcement of a set of tools and APIs for card issuers and merchants to establish instalment solutions sent the company down 15% in under two hours on the last day of the financial year. Bizarrely, the release from Visa surfaced before the ASX opened and Afterpay was up. We are glad to see such inefficiencies in the market! Visa’s unique position ‘upstream’ in the payment ecosystem from Afterpay puts it in a powerful position to grow quickly and fairly seamlessly. Our take on this development is that whilst Visa could dominate Afterpay on a global offering, Afterpay retains the first mover advantage in the way that these are merely a set of tools to create an instalment service. Visa’s business model has historically been to take on limited credit risk (much like that of Mastercard). Visa does not issue lending products, purely offering the back end for their partners. There has been nothing to indicate that this will change in the short term. Consequently, the risk would have to be taken on by the merchants (unlikely) or the card issuers, who presently make the majority of their money from interest and a smaller amount from interchange fees – while transaction/network fees are the largest revenue source for Afterpay/Visa. Nonetheless, we will be watching this development closely as widespread adoption does have the ability to jeopardise Afterpay’s offering. We believe Afterpay’s first mover advantage, as well as the necessity for card issuers to alter their business models, make it safe – for now.

Stanmore Coal (SMR:ASX)

We have continued to build a position in Stanmore Coal over the last year and it is now the fund’s largest holding. Stanmore owns the Isaac Plains mine, a metallurgical (also known as coking) coal mine with significant mine life (over 15 years) located in Queensland’s premier coal region, the Bowen Basin. In addition, a small amount of thermal coal is produced from the project. Mining is currently at a rate of 2.9Mtpa, with the product being exported to key customers in the steel manufacturing industry. Exposure to China’s slowing economic growth or political chess is a minimal threat to Stanmore’s earnings since around half of Stanmore’ customers are in Korea and Japan, while Europe and India represent most of the remaining bulk of the customer base:

As an aside, it should be noted that we believe China’s impact on the Australian coal market, whilst significant, is not as significant as commonly portrayed – Japan imported 50% more Australian coal (preferred for its relatively low ash content) than China in 2017.

Isaac Plains East Project
Stanmore acquired Isaac Plains East in 2015. There are significant synergies through the acquisition since the project can use Isaac Plains’ CHPP and rail network rather than engaging in capital expenditure. Operations commenced in June 2018.

Other Mining/Exploration Opportunities
Isaac Downs was acquired in 2018, with consenting and approvals underway. Isaac Plains South is in exploration phase. Stanmore also has a portfolio of over 2,000km2 of exploration tenements in the Bowen Basin and Surat Basin, as well as 2 JVs with coal junior, Bowen Coking Coal (ASX:BCB).

Coking Coal – The Evil(?) Elephant in the Room
Recently, some of our team attended an Australasian Institute of Mining and Metallurgy (AusIMM) panel event with the topic “Does coal have an image problem?” – The answer, supported by numerous Australian media houses, a resounding “Yes”. It is astounding to note that the majority of the Australian public relates coal solely to power generation. However, there are two types of coal:

  1. Steam/Thermal Coal (mostly used in power generation)
  2. Coking/Metallurgical Coal (higher grade coal, used in steel production)

While the great majority of Australians hope there will be cleaner power generation in future, most (Insufficient Capital’s management included) also see steel production as a future necessity in a continually developing world. Since steel production will remain crucial until there is a foreseeable replacement for the product, Insufficient Capital will continue to evaluate metallurgical coal opportunities.

A key takeaway from the AusIMM panel event was the difficulty in financing new coal projects. Australian banks and other lenders are shying away from lending to coal firms (pressured by the public spotlight on coal). Future projects are much more likely to be financed through retained earnings and private/offshore capital rather than through debt financing. Stanmore is in an enviable position, well-prepared to fund future projects through its retained earnings. Net cash increased to $58.4M (market capitalisation $353M, no debt) through the March quarter. The firm also recently instigated an on-market share buy-back of up to 10% of stock.

Coal Price Risk?
Many funds choose to shy away from any exposure to commodity price risk. We do not pretend to be experts in commodity price movements (or more specifically, the individual factors which affect a commodity’s demand and supply). We also acknowledge that the largest lever for Stanmore’s performance is completely out of our control. However, there are three key factors which alleviate the vicissitudes of metallurgical coal prices:

  1. High Margin: Stanmore has low FOB costs of $88/tonne and a high margin, translating to expected underlying EBITDA of $140-$155M for FY2019. Stanmore’s FOB cost has also fallen around 10% since Q1 FY2019 as the company achieved further synergies through the Isaac Plains East project. We are confident that there is enough margin in Stanmore’s production to weather a significant drop in metallurgical coal prices.
  2. Valuation: We will discuss Stanmore’s valuation later on in the newsletter. We are content to have metallurgical coal price risk mitigated by a valuation 40% below industry peers similarly exposed to the commodity’s price risk.
  3. Strong Balance Sheet: At the end of Q3 FY2019, Stanmore had $58.4M net cash. This cash will likely be deployed when coal prices are lower as greater opportunities prevail. The firm’s fiscal conservatism reflects the views of the experienced management team. We have entrusted our capital to a proven team who have expertly negotiated coal price movements throughout the business cycle in their prior roles.

Management
Insufficient Capital strongly backs operationally focussed management, particularly in the resources sector where it can be make or break for the firm’s longevity. As a result, it is no secret that we are huge fans of Stanmore’s management and board, awash with former Glencore Coal, Rio Tinto and Wesfarmers Resources leadership. In particular, it is very reassuring to see three ex-Glencore employees on Stanmore’s four-person leadership team:
Dan Clifford (Managing Director) – Former GM of Glencore’s Ulan Coal, Bernie O’Neill (General Manager Operations) – Former GM of Glencore’s Newlands/Collinsville Coal, Jon Romcke (General Manager Development) – Former Head of Iron Ore assets for Glencore International.

Dividend Reinvestment Plan (DRIP)
In April, Stanmore paid a 3c/share interim dividend, reflecting an annualised yield at the time of around 5%. We believe that the firm’s dividend yield will increase over time through greater future cashflows coupled with 10% fewer shares on the registry (if the 10% buy-back is completed). Stanmore offers a dividend reinvestment plan at a very attractive 5% discount to the VWAP over the short period following the ex-dividend date. We took part in the last DRIP according to our investment ground rules (See investing Ground Rule* #9), a lucrative decision for the fund. Shares received in the DRIP have since appreciated over 30%.

Valuation
Stanmore Coal has experienced management, low production cost and superb future opportunities. However, the firm trades at 2.3X EBITDA, a 40% discount to some of its larger peers. We believe Stanmore should be trading at 4X EV/EBITDA due to its strong cashflow generation, operational expertise and consistent upgrades to mine development.

Quip of the Month

Liam Twigger, PCF Capital Group MD, said of M&A activity:
“Too many companies are looking for a Brad Pitt when in the right circumstances, they might be able to settle for a Bart Simpson.”

At Insufficient Capital, we do not strive to relate pop culture to investment theory. However, Liam’s argument rings extraordinarily true, particularly in relation to the energy industry. Stanmore bought Isaac Plains (then a mothballed, unwanted mine) for all of $1 from Vale and Sumitomo. Rather than searching for an expensive acquisition with a lower risk profile (Brad Pitt), Stanmore took on the challenge of an unloved asset (Bart Simpson), striving to make it work by applying experienced management. If we were to take this metaphor further, we’d say that Stanmore’s management are comparable to Steven Spielberg, a director who could generate great results from Bart. In time, we will see what Spielberg has in store for Stanmore.

Liam’s remark relates to a core dilemma of value investing – Should we pay a fair price for a great opportunity or a great price for a fair opportunity? Warren Buffet argues the former. However, Stanmore clearly observed the latter. Insufficient Capital has a rather unhelpful, on the fence belief, that each opportunity requires case by case analysis. We are happy to follow either school of thought.

If subscribers would like further details on our activities, we are always happy to discuss portfolio positions.

Kind Regards,
Insufficient Capital

Exit mobile version