Insufficient Capital December Update

Happy New Year to our much appreciated subscribers. 2020 was a devastating year that we will all be happy to put behind us. The terrible events of the year, which continue to take the lives of the world’s most vulnerable, truly remind us of the relative unimportance of strong financial performance when one’s health is compromised. We hope that as the Covid-19 vaccine is gradually rolled out, that the world can return to some level or normality and that 2021 may be a fulfilling, healthy and prosperous year for you all.

Performance Figures

The portfolio rose +31.11% over the first half of the Australian financial year, outperforming the ASX200 performance of +13.69% by +17.42%. The top contributor during the half was Afterpay (APT:ASX)… yet again. There were no detractors during the half. The weighted average market capitalisation of our portfolio is $AU6.8 billion (up from $AU2.9 billion at H2 2020). The portfolio currently has 1.12% cash and is most heavily weighted to our ‘Structural Tailwinds’ strategy. 

Quarterly Portfolio Changes

There were two key portfolio changes during the half. These were: 

  1. Purchase of Redbubble (ASX:RBL)
  2. Purchase of BetMakers (ASX:BET) – Will be discussed in a future newsletter

Redbubble (RBL:ASX)

“Millions of new consumers have been exposed to online, many of them will continue to shop in this way. This is particularly true in the case of Redbubble because the content is created by hundreds of thousands of independent artists, it is ever-moving and always relevant. This is all made possible by an on-demand business model.” – Martin Hosking, Redbubble Co-Founder

What is Redbubble? 

Redbubble (founded in Melbourne in 2006) is a leading global marketplace selling products with independent artists’ designs printed onto them, delivered from 41 fulfillment locations across the world. Unlike other ASX-listed e-commerce businesses, only 6% of Redbubble’s revenue is recorded in Australia.  It is personally fulfilling to own part of a company which supports creativity. 

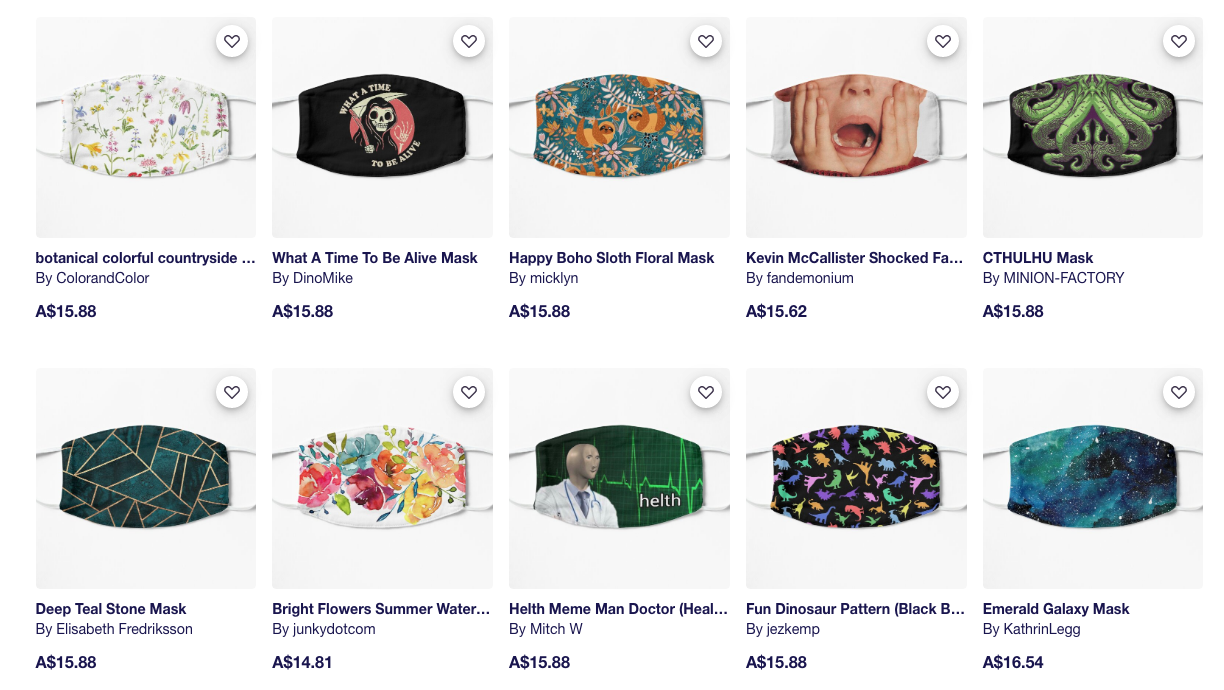
Redbubble’s unique structure allows artists to choose their own mark-up on base products, effectively controlling their ‘Artist Margin’. However, artists quickly discover the concept of price elasticity of demand and find a margin which maximises their revenue. As shown below, artists often copy each other’s Artist Margin and there is not a large price range. 

Redbubble’s product offering is uniquely priced to benefit both artists and consumers, with competition amongst the 500,000+ artists keeping prices reasonable, whilst allowing the artist to have complete control over their margin. In FY20, artist revenue was $AU67.4M (16.2% of the total sales of $AU416.3M) i.e. Redbubble collected revenue of $AU348.9M ($AU416.3M-$AU67.4M) net of artist revenue.

Pricing Example:

T-Shirt Base Price $AU15 (cost of manufacture plus Redbubble’s gross profit margin) > Artist’s Markup 20% (the markup set and edited by the artist) > Artist Margin $AU3 (T-Shirt Base Price multiplied by Artist’s Markup = margin collected by artist) > Retail Price $AU18 (T-Shirt Base Price + Artist Margin)

Popular products include T-shirts, stickers, phone cases, and most recently, masks. Masks have been sold through Redbubble since April and have been promoted to their own website category. The company is clearly taking advantage of a short term spike in demand for masks due to COVID-19. This is a key tailwind for Redbubble since masks are becoming as much of a fashion statement as jewellery or handbags. 

Whilst many may be quick to dismiss this surge as a fad based around Covid-19, we believe that the demand for face masks today is likely to seed future sales in other categories from returning consumers. Repeat sales already account for around 40% of Redbubble’s revenue. Redbubble is directing website space (masks are positioned prominently at the top of the website) and ad spending towards masks because that is currently the most in demand product category. It is not because the other areas of the business are struggling. 

TeePublic Acquisition

Redbubble’s proposition as a leading platform for artists to monetise their talents and for consumers to source a broadening range of unique products looks unlikely to change given its step-change in scale. Redbubble’s 2018 acquisition of TeePublic for $AU41M (at a multiple of 12.4X EBITDA) has gifted the company with further economies of scale through additional distribution partners.

Significant Founder Ownership

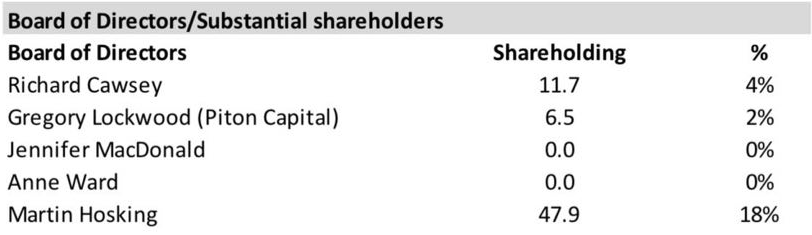
With technology firms trading at lofty valuations, one factor we look for to distinguish potential investments is a high level of founder ownership. At the end of FY20, Redbubble founder, Martin Hosking, held 18% of the company (although he recently reduced his holding to 16%). This high level of founder ownership is rare for an ASX-listed $AU1B+ capitalised company.

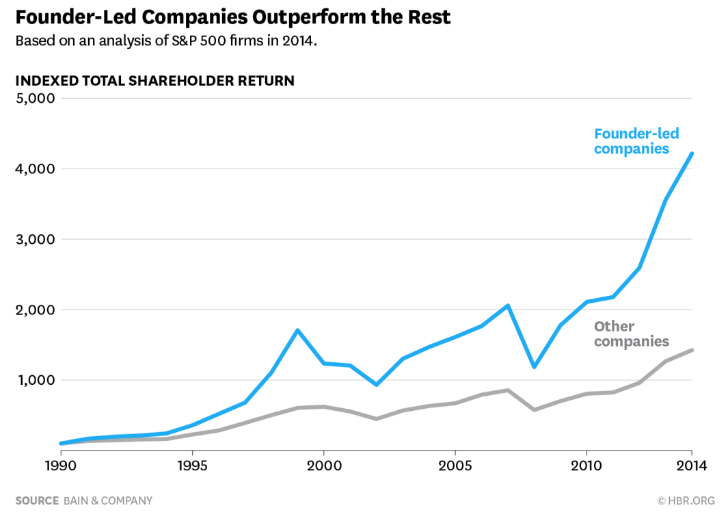
Founder-led S&P500 businesses have significantly outperformed their counterparts, driven by well-known consumer-centric brands such as Amazon and Facebook. In an Andreessen Horowitz blog, the firm outlines three reasons why founder-led businesses are the most attractive investment propositions. Founders typically have:  

  1. Comprehensive Knowledge: exhaustive understanding and passion for the product, customer, business and market 
  2. Moral Authority: willingness to abandon initial methods to challenge industry norms and continue to innovate 
  3. Total Commitment to the Long Term: willingness to undertake long term strategic investments, which will help build a company that lasts longer than the founder

Whilst he is no longer the CEO (and thus, Redbubble is not founder-led in the true sense of the phrase), we are confident that Martin Hosking is truly dedicated to the continued growth of Redbubble’s marketplace and has no desire to step away from the business he founded. 

Furthermore, we are confident in the ability of Redbubble’s newly appointed CEO, former SEEK executive (CEO of Asia Pacific and Americas), Michael Ilczynski. Michael and Redbubble entered into a non-recourse loan arrangement with a loan amount of $AU1,600,000. The loan plus $AU400,000 of Mr Ilczynski’s own funds will be used to purchase $AU2,000,000 of Redbubble shares on-market after the release of Redbubble’s H1 FY2021 results – such a financial commitment is far more than just a display of meek confidence for retail investors.

Positive Tailwinds

Participants in equity markets have recently realised that the triple digit revenue growth rates recorded by some e-commerce businesses cannot last forever (if you could double $0.01 every day for a month, you would have $5.4 million by the final day). Consequently, well-loved e-commerce stocks have sold off and traditional ‘old world’ value (e.g. banks, REITs, infrastructure) stocks have returned to vogue. 

That being said, once COVID-19 is (hopefully) a distant memory, Redbubble will undoubtedly retain a proportion of customers who have purchased masks through retargeting of its highly engaged site visitor base (16 mins 11 secs average daily time on website). The 16 minute average daily time on site is comparable to social networking companies. The average visitor spends more time on Redbubble than on Twitter (12 mins 47 secs) and Instagram (8 mins 49 secs). Other e-commerce businesses record much lower site engagement (e.g. Kogan – 3 mins 42 secs).

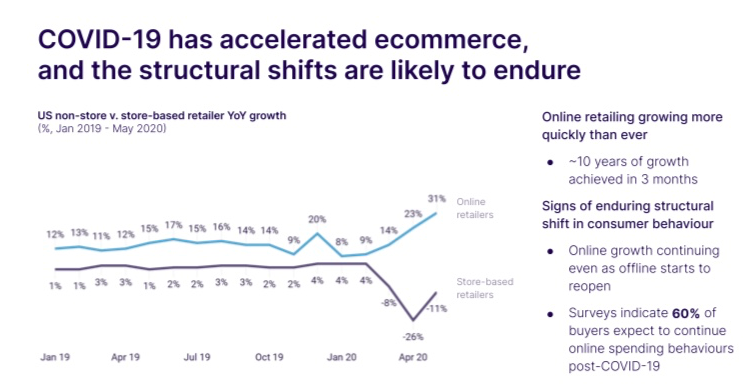
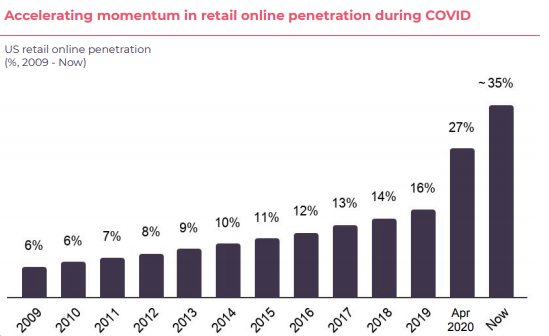
The other key (and more reliable) tailwind driving Redbubble’s sales growth is the COVID-induced structural shift towards e-commerce. Redbubble’s research reveals that COVID-19 has brought forward 10 years of online retail growth in just 3 months. Our other sources range from 5 to 12 years of growth over the period. People around the world have been forced to shop online and have realised that the experience is generally quick, simple and reliable.

Such digital shifts in behaviour are rarely reversed.

Customer growth has clocked in at 33%/annum over the last 5 years and has been achieved with pleasingly low costs of customer acquisition. Paid acquisition (Marketing) is astoundingly low, at only 10.2% of total revenue (Q1 2021, down from 11.4% over FY2020). In comparison, some of Redbubble’s peers spend up to 26% of revenue on marketing. Redbubble’s 511,000 artists are the company’s biggest voice, spreading the word about their online stores to bring customers to Redbubble free of charge – after all, it is in the artists’ best interests and represents a critical part of the company’s ‘flywheel effects’. 

FY2020 Results

Revenue contribution by product and region is outlined in ‘Q1 2021 Results’. At the end of FY20, Redbubble had 511,000 artists selling on the marketplace (+51% on FY19), with 6.8M unique customers (+30% on FY19) making at least one purchase. The 51% uplift in contributing artists is a critical vote of approval for the marketplace, with more and more artists seeing the benefit of selling through Redbubble to generate income. The uplift has also been supported by another key tailwind – the evolution of the unconventional ‘side-hustle’, whereby many people (particularly Gen Z and Millenials) aim to generate a secondary income source outside of their main day to day job. This secondary income helps to support increased debt burdens for young adults across the world, whilst education, healthcare and residential asset prices have continued to increase faster than wages growth.

The growth in contributing artists is critical to developing Redbubble’s ‘flywheel effects’. There are three core elements of the flywheel:

  1. Artists and Content 
  2. Loyal Customers
  3. Fulfilment and Operations

Redbubble’s capabilities, contributing artists and customers drive scalable 3rd party fulfilment across a global network of 41 fulfilment locations.

Real-Time Business Indicators

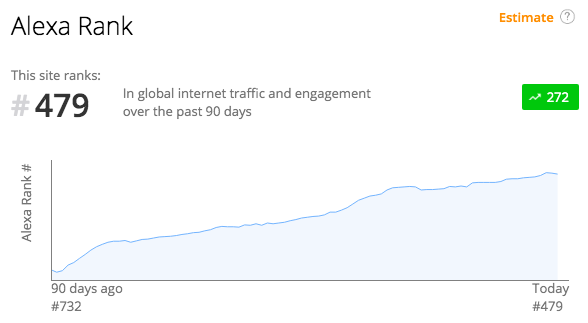
At Insufficient Capital, we monitor a myriad of real-time business indicators, particularly those relating to consumer behaviour. Trends give us a ‘feel’ for how a business is tracking long before its periodic quarterly/half-yearly updates to the market. We often use Alexa’s Site Overview tool to monitor global internet traffic and engagement for B2C firms. As at 15 October 2020, Redbubble’s website ranked #479 by global internet traffic and engagement (up from #732, 90 days previously – a phenomenal uplift in interest). There is a power law at play in site ranking, with each jump up the ranks becoming ever more difficult.

Q1 2021 Results

Redbubble’s Q1 results were nothing short of extraordinary, with the business effectively transitioning into rapidly increasing profitability (with high margins supported by well-targeted paid acquisition) as the business scales. The 43.7% gross profit margin recorded was the company’s best on record. 

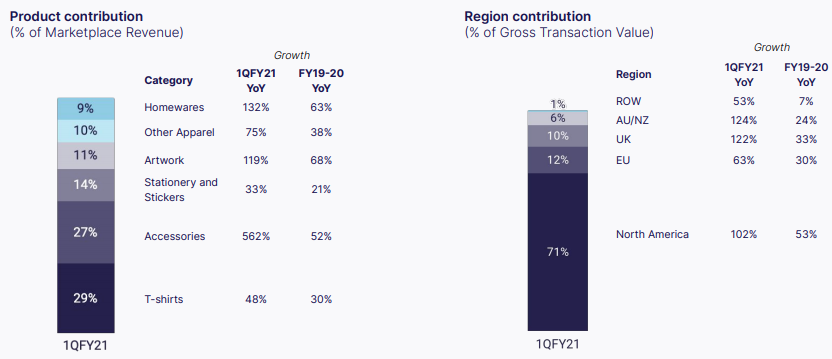
At the end of Q4 2020, masks represented 27% of total sales but fell to 14% by the end of Q1 2021 (still high but significantly less). This drop in mask contribution makes the overall Q1 revenue growth of 116% even more extraordinary. The ANZ region (6% of gross transaction value) was a stand-out, with growth accelerating from 79% yoy in Q4 2020 to 124% yoy in Q1 2021.

We are confident that future quarters will benefit from further customer acquisition and increased customer loyalty, alongside increased optimisation of the fulfilment network. 

Valuation

We believe that Redbubble (RBL:ASX) is the last remaining pure e-commerce business on the ASX without a demanding ‘e-commerce valuation’.

The business currently (Q1 2021) has $AU85.4M of cash in hand and no debt. Management have not been in this cashed up position before and are still deciding on capital allocation, but have confirmed that they will not be returning capital to shareholders. We almost always support capital reinvestment policies and would generally prefer our portfolio companies to back themselves, just as we have backed them to allocate our capital. See below comparisons between Redbubble and other listed online marketplaces (although it is important to note that the comparables are not necessarily analogous). We believe that Redbubble’s ‘flywheel effects’ discussed above make it a superior (and more scalable) business to most of its comparables. Etsy is Redbubble’s closest peer and trades at a very rich 13.6X Forward EV/Sales. Kogan is the only peer trading at a significantly lower forward EV/Sales multiple than Redbubble, whilst eBay and Alibaba are the only peers trading at significantly lower forward EV/EBITDA multiples (however, both are growing slower than Redbubble). 

If Redbubble’s FY21 marketplace revenue growth is only 49%, we would be very surprised. We expect closer to 60% growth, building off the phenomenal 116% achieved in the first quarter. We would love to own Redbubble for 3+ years as the firm’s marketplace continues to attract artists and customers. 

We believe that Redbubble can grow revenues and EBITDA by 25%/annum over the next 5 years, benefitting from structural tailwinds and significant points of difference. We conservatively assume that there will be no further economies of scale contributing to margin expansion. In Q1 2021, gross margin expanded from 37.8% (Q1 2020) to 43.7%. Generally, on a sales multiple, we value Redbubble at 4X 2025 EV/Sales ($AU8.4 billion valuation = 5.7X today’s valuation as at 16 October 2020). On an EV/EBITDA multiple, we value Redbubble at 25X 2025 EV/EBITDA ($AU7.1 billion = 4.8X today’s valuation as at 16 October 2020). Both basic back-of-the-envelope valuations yield >35%/annum returns over 5 years.

What Could Go Wrong?

Whilst there are many risks to the success of the business, in the interests of attention span, we will discuss only litigation (a unique risk specific to Redbubble). Redbubble’s role as an intermediary for user-generated content exposes them to litigation risk as a result of intellectual property infringement. Currently, Redbubble will only review designs when someone submits a takedown notice. Another way Redbubble is addressing this issue is through their Partnership Program, which is a licensing agreement with rights holders. There are currently 67 content partnerships to promote the integrity of hosted content. 

There have been some favourable decisions including recently in the United States, a clear vote of approval for Redbubble’s business model and IP enforcement procedures and mitigation strategies. However, litigation regarding IP rights is inherently uncertain and laws in certain jurisdictions could change unfavourably.

Performance of our Corona Watchlist vs the ASX300 

In the depths of the coronavirus-triggered market correction, we put together a ‘Corona Watchlist’ of potential investments, which were discounted by the market panic. The watchlist’s 11 constituents were our key areas of research during the correction. Our Corona Watchlist and its performance as an equally weighted index are available here

Cadence Capital is the only Corona Watchlist member which has been added to our portfolio. We outlined our thesis for Cadence Capital in our end of financial year newsletter. As an index, the watchlist has outperformed the ASX300 by +34.6% since 31 March (2.17 times the ASX300 index return of 29.5%). The weighted average market capitalisation of the watchlist is >$AU20 billion. The best performing stock in the watchlist has been Resimac, a premier non-bank lender, which is up 260%. In contrast, Charter Hall Long WALE REIT, a diversified REIT, has been the worst performing stock in the watchlist, gaining only 5.2% since March 31 as uncertainty regarding the future of commercial property (offices and traditional retail stores in particular) continues to loom over the entire sector.

Two additional watchlists are available on our website: ‘Microcap Watchlist’ and ‘International Watchlist’. The International Watchlist has performed particularly well (+82.4% since March 31), outperforming its benchmark MSCI World Ex-Australia Index (+18.2% since March 31) by 4.5X. Interestingly, only 1 of the 20 stocks on the watchlist are down over the period: Bank of China. Alpha Bank and Unibail-Rodamco Westfield have also performed particularly poorly – all three are old world stocks in a brave and competitive new world. In contrast, Carvana and Tesla have both more than quadrupled in value since March 31 – new world autos winning an old world industry.

Quip of the Quarter

“Investing should be more like watching paint dry or watching grass grow. If you want excitement, take $800 and go to Las Vegas.” – Paul Samuelson, America’s first Nobel Prize winner in economics. 

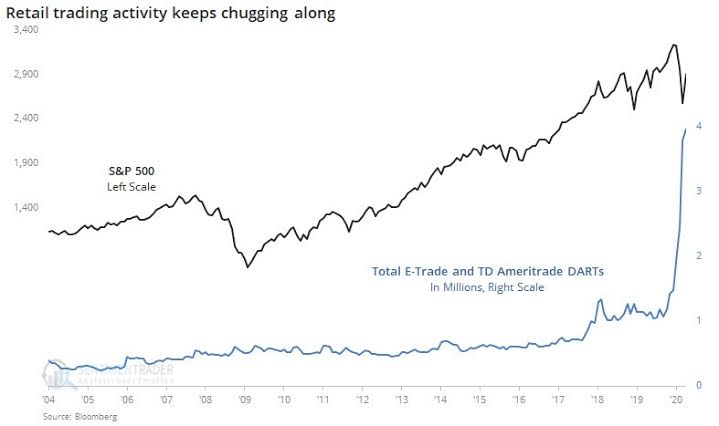
There is no doubt that market sentiment has significantly shifted from the deep fear of the March lows (and, just like every other market crash, the world did not end) to whispers of euphoric greed recently. Whether capital is flowing into the latest hot IPO, Buy Now Pay Later or ‘cutting edge’ medical opportunity, there is no doubt that vast amounts of cheap capital are sloshing through the bourse. The dichotomy between hot and not has never been greater. Financials and REITs have languished for the past 6 months, whilst tech and healthcare dash through prior highs. In time, there will be a great many ‘A-Ha Moments’, with some traditional ‘value’ stocks trading much higher. We hope that we own a couple of these unloved opportunities, with some investors continuing to behave like restrictions have been lifted at The Bellagio. 

If you would like further details regarding our activities, we are always happy to discuss portfolio positions. We encourage you to follow us on Instagram and Twitter, where we share more regular bite-sized commentary. 

Insufficient Capital June Update

Welcome to our first end of financial year newsletter. 

We are very proud to have completed our first full year of operations, achieving significant outperformance (+24.96% vs ASX300 performance of -10.81%).

The structure of this newsletter will be: 

  1. Thank You
  2. Performance Figures
  3. Quarterly Portfolio Changes (including our favourite new opportunity)
  4. Performance of our Corona Watchlist vs the ASX300
  5. Podcast with Frazis Capital Partners
  6. Quip of the Financial Year

Thank You

When we launched our newsletter, we never anticipated the reception it has received. Primarily through word of mouth from you, our readers, we now connect with north of a thousand market participants – we’re always striving to improve our content, and hope that we can continue to share ideas with many more investors in the future.

Performance Figures

The portfolio rose +90.1% over the June quarter, outperforming the ASX300 performance of +16.5% by +73.6%. The top contributor during the quarter was Afterpay (APT:ASX). There were no detractors during the quarter. The weighted average market capitalisation of our portfolio is $2.9 billion. The portfolio currently has 8.6% cash and is most heavily weighted to our ‘Structural Tailwinds’ strategy. 

Quarterly Portfolio Changes

There were three major portfolio changes during the quarter. These were: 

  1. Full exit from Stanmore Coal Ltd (SMR:ASX)
  2. Partial sale of Afterpay Ltd (APT:ASX)
  3. Purchase of Cadence Capital Ltd (CDM:ASX)

Stanmore Coal Ltd (SMR:ASX)

On 2 April, Golden Investments Pte Ltd (Golden) announced an on-market offer of $1.00/share for SMR – their second bid for the company (having had an off-market $0.95/share offer rejected 13 months earlier). At the time of the announcement, Golden already owned 31.5% of SMR. Golden returned to SMR during the depths of coronavirus despair. We initially viewed the $1.00 bid as highly opportunistic when considering that Stanmore received a non-binding, indicative proposal from Winfield (a private group with experience in the Bowen Basin) in August 2019 for between $1.50 and $1.70/share. Whilst this unfortunately fell through, as discussed in our End of Year Update, the proposal indicated the potential value of the firm and the stock hit $1.50. Unfortunately, we did not take the exit opportunity.

It was clear that $1 (market capitalisation of A$270.4 million) was the highest price that would be achieved (although, there was also a 1 for 33 bonus issue). Muscled out during a time of opportunity, we exited the position. We first entered the position in November 2018. Overall, we made +5.8% from the investment (beating our ASX300 performance benchmark over the same period by +8.7%). Whilst it is always pleasing to beat the benchmark, there was no ‘warm fuzzy feeling’ in letting this company go. Golden has benefited from a highly opportunistic bid. 

Taking a glass half full view… whilst we lost out on one opportunistic coronavirus acquisition, we have benefited from another. The coronavirus provided an opportunity for EML Payments Ltd (EML:ASX) to renegotiate their acquisition of Prepaid Financial Services (Ireland) Ltd (PFS). PFS was fundamental to EML’s strategy of transitioning from a company deriving the majority of its revenue from gift cards, to one deriving the majority of its revenues from less cyclical general-purpose reloadable programs. The acquisition will allow EML to build a larger competitive moat around their business and better compete with $43 billion payments giant, Square (SQ:NYSE). On 31 March, EML completed the acquisition, paying A$252.3 million (reduced from the previously negotiated A$433.6 million). The renegotiated acquisition has ensured that EML remains in a position of fiscal strength throughout the current period of economic uncertainty, with in excess of A$125 million in net cash. The combined group has a total cash overhead expense rate averaging between A$5-6 million per month so there will be no need to raise capital at today’s heavily depressed valuation. We expect that EML will build its cash pile until it can justify another earnings-accretive acquisition. 

Afterpay Ltd (APT:ASX)

In May, we exited over half of our Afterpay position. We have often said that if nothing fundamentally changes within a business, there are very few reasons to trim its portfolio weight. There were a few key reasons why we trimmed this one:

  1. As we said in our last newsletter, three businesses will always make up at least 40% of the Insufficient Capital portfolio. Prior to the partial sale, Afterpay was our largest portfolio position and is still included in our top three positions after the sale. 
  2. The coronavirus has provided many new investment opportunities. Afterpay has recently surged to an all time high valuation, gaining well over 500% (yes, 500% with two zeroes) from its COVID-19 low. Was it oversold at a valuation of A$2.38 billion? Evidently. However, many businesses have recovered less strongly. Some of these are justifiably low. Others are not and we believe that capital should be allocated to these opportunities (many of these opportunities can be found in our various watchlists, available on the website). If Afterpay successfully executes in international markets and continues to execute domestically, we value the business at A$31 billion at the end of FY2024 (approximately 2X above today’s valuation). If we were not in a severe bear market, with many opportunities available and potential second-order impacts on unemployment, we would not have cut our position. We believe that over four years, opportunities to more than double our money are available elsewhere, with a lower risk profile.
  3. As we alluded to above, potential second-order impacts on unemployment (structural unemployment in particular) are yet to be seen. Afterpay provides short-term credit to its customers… even though it claims otherwise to some government regulators! If many of Afterpay’s customers remain unemployed for longer, they will spend less on discretionary goods and services. It is truly impossible to grasp the economic outcomes of today’s never-before-seen unemployment benefits, and ultimately, the higher future taxes required to fund them. The only (rather obvious) fact we know is that consumers with less after-tax income will spend less on discretionary items. With increased unemployment comes the risk of a higher default rate (Afterpay’s current default rate is 1.0%). The short duration loan book allows Afterpay to react swiftly to economic threats, quickly lowering spending limits, increasing credit checks and adjusting other variables. The firm is yet to face a full credit cycle. This uncertainty makes a very large position size uncomfortable. We like to sleep well at night.
  4. We are hearing the bullish case for Afterpay in media and investment channels more than ever before. Many people are using this bear market as an opportunity to invest for the first time. The bear market opportunity is compounded by global social distancing measures which promote staying at home to research the market and/or day-trade (most studies show that around 95% of day-traders lose capital… but that’s another story). The chart below reveals that US trading volumes have quadrupled since the start of the equities tumble. Many first-time investors buy well-known brands, such as Google, Apple, Facebook, Coca-Cola, Starbucks, Disney… and Afterpay. We believe that a vast amount of valuation-agnostic, short-term capital, is flowing into well-known brands such as Afterpay. When considering this extra variable, we are reminded of our 7th Ground Rule: “Be fearful about any investment being hyped in the media and market”

Despite the above points, we remain very positive on Afterpay’s business and management’s ability to execute. According to its 14 April announcement, March 2020 was Afterpay’s third largest underlying sales month on record, behind the Christmas months of November and December 2020. Q3 FY20 underlying sales increased 97% on Q3FY19. We would not be surprised if June 2020 is now Afterpay’s third largest underlying sales month. The business has only scratched the surface and we are very happy to retain a top three portfolio position. 

Cadence Capital Ltd (CDM:ASX)

We first discussed CDM and Listed Investment Companies (LICs) more broadly in our September 2019 newsletter. Since then, we have continued to monitor CDM, recently adding it to our Corona Watchlist and finally, our portfolio. This demonstrates the significant amount of work we put into analysing an idea before we add it to our portfolio. Whilst we generally prefer to choose the businesses we own, sometimes there are significant price dislocations which present opportunities in listed actively managed funds such as CDM. 

In September 2019, we wrote: we continue to evaluate Cadence’s portfolio and would not be surprised if it became a future position of ours… well well well. Fortunately, we did not purchase Cadence in September. At the end of September, Cadence’s post tax net tangible assets (NTA) was $1.048, whilst trading at $0.810 (a discount of 22.7%). As at 30 May 2020, post tax NTA was $0.979, whilst trading at $0.595 (a much steeper discount of 39.2%). The  end of June NTA and portfolio update will be released around 13 July. We believe that CDM’s portfolio has never looked better and is full of very high quality businesses that we love to own at the current discount. Our favourite Top 20 Cadence holdings (see entire list below) are: Resimac Group (RMC:ASX), EML Payments (EML:ASX), Macquarie Group (MQG:ASX), Facebook (FB:NASDAQ) and Credit Corp Group (CCP:ASX).

Cadence has moved from trading at a premium to NTA to trading at a discount to NTA over the last seven years. Does it surprise us? Not at all. Even Cadence’s founder/portfolio manager, Karl Siegling, said (at an annual general meeting) words to the effect of: “People will generally always sell at a discount and buy at a premium”. This was seen recently, when raw panic drove CDM down to $0.49 on 31 March 2020 despite net assets of $0.881/share (a huge discount of 44.4% made even more incredible when considering that the fund held $0.497/share of cash at the time, effectively valuing its equity holdings below 0). 

We’ve looked back through Cadence’s past newsletters to see how its premium/discount has changed since January 2013. The average discount over the entire period is 3.67%, while the average discount over the past two years is -21.58%. CDM’s current portfolio is full of well-known brands (aligned with Ground Rule No. 5) and is highly liquid. We believe that the extent of the current discount offers a tremendous opportunity when looking beneath the hood at Cadence’s individual portfolio constituents. 

Three catalysts for Cadence’s discount to NTA closing include: 

  1. Strong portfolio performance – Investors generally value a high-performing management team. For example, WAM Capital (WAM:ASX) trades at a 13% premium to NTA and has returned 15.7%/annum since August 1999, outperforming its benchmark by a phenomenal 8.0%/annum.
  2. Regular dividends – In a world where 0% returns are the new normal, Cadence and other LICs are a compelling investment proposition, particularly for retirees.
  3. Share buy-back schemes – These indicate to the market that the LIC’s board believes the fund is materially undervalued. They also effectively increase the LIC’s NTA whilst it is trading at a discount (see below for details regarding Cadence’s share buy-back).

We formed a view that Cadence satisfies all of our LIC investing Ground Rules (not to be confused with our general investing Ground Rules): 

  1. The LIC must have a significant discount to NTA 
  2. Investment strategy must align with our general investing Ground Rules
  3. Reasonable fee structure
  4. Strong track record (particularly during downturns)
  5. Management alignment and significant personal investment
  6. Share buy-back schemes are preferable  

Cadence’s founder has been buying shares nearly every day (this is not an exaggeration) and owns just under 8% of shares outstanding. Siegling backs himself. Recently, two other directors joined Siegling and purchased units. The company proceeded to announce an extension of the existing market share buy-back (on 20 May) of up to 10% of ordinary shares outstanding. This should increase the fund’s NTA per share whilst it trades at a discount as the portfolio is effectively rebought at a discount.. We believe that Cadence’s active capital management is prudent and value-accretive in this current environment. 

Cadence has a long history of dividend payments (see below) and has historically targeted a fully franked dividend yield of 6-8%/annum. Whilst trading at a discount, Cadence is not offering a discounted dividend reinvestment plan. This would have the opposite effect of a share buy-back, decreasing the fund’s NTA by issuing shares at a discount. Returning capital to investors in the form of dividends (with franking credits) is highly tax-effective for Australian investors. As yields continue to fall globally, CDM’s target yield is difficult to maintain (although the current discount is definitely helping!) 

Cadence is currently our favourite COVID-19 opportunity. The position has appreciated significantly since our purchase (outperforming the ASX300 by +3.5% over the quarter) but has trailed the rest of our portfolio. We believe that there is low downside risk for the position with so much fear already priced into the discount. Our simple calculation for the expected return of our investment in CDM is:

  1. Performance of underlying portfolio (NTA growth), which has been negatively impacted by COVID-19
  2. Reduction in discount to NTA as panic clears and greed returns (the panic-greed cycle in markets is almost as certain as death and taxes)

Performance of our Corona Watchlist vs the ASX300

Our Corona Watchlist and its performance as an equally weighted index are available here. Cadence is the only watchlist member which has been added to our actual portfolio. Whilst the other 10 constituents have not yet made the portfolio, they remain our favourite opportunities (and areas of research) during this downturn. As an index, the watchlist has outperformed the ASX300 by +11.7% since 1 April. The weighted average market capitalisation of the watchlist is $23.1 billion.

Podcast with Frazis Capital Partners

At the end of June, we recorded another podcast with Frazis Capital Partners on “Plug Power, Solaredge, and a market update”. The podcast (and all prior podcasts recorded with Frazis Capital) can be found here.

Quip of the Financial Year

“Wall Street never changes, the pockets change, the suckers change, the stocks change, but Wall Street never changes, because human nature never changes.” – Jesse Livermore (Livermore was the basis for the main character of ‘Reminiscences of a Stock Operator’)

COVID-19 was the defining moment of FY2020 for both society and financial markets. The virus may go down in history as the defining moment of the decade, bringing forward long-term structural shifts such as working from home. We believe that our world has materially changed, but we won’t know the full extent of the changes for many years. Looking into the future (and as a reflection of our commitment to being an active investment company) our FY2030 newsletter will likely reflect these structural changes… although we aren’t buying Zoom (NASDAQ:ZM) and Peloton (NASDAQ:PTON) just yet.

Livermore invested through the turn of the 20th Century, WWI and The Great Depression. One thing that has not been changed by COVID-19 is human nature. In the depths of despair, investors sell their shares at the worst possible time. Money market fund assets have ballooned by around 30% since the coronavirus struck down equity markets in March. The perpetual cycles of ‘Buy high/sell low’, ‘Greed/Fear’, ‘Exuberance/Panic’ were alive and well when Livermore made his first $5 bet on Chicago, Burlington and Quincy Railroad in 1892. 

If you would like further details regarding our activities, we are always happy to discuss portfolio positions. We encourage you to follow us on Instagram and Twitter, where we share more regular bite-sized commentary. 

Kind Regards,

Insufficient Capital

Insufficient Capital January Update

Performance Figures

The portfolio rose +9.67% over January, outperforming the ASX300 performance of +4.89% by +4.78%. We were very pleased with the result – a great start to the decade. Such strong index performance is incredibly hard to keep up with (let alone, outperform) when holding any cash or gold. We always endeavour to allocate all of our capital (according to Ground Rule #10) to avoid underperformance during strong months like January. However, we will only allocate capital when opportunities are sufficiently attractive to satisfy Ground Rule #12.

The top contributor during January was Afterpay while the largest detractor was Stanmore Coal. The weighted average market capitalisation of our portfolio is $3.3 billion. The fund currently holds 12% cash. 

At the end of January, the fund was most heavily weighted to our ‘Structural Tailwinds’ strategy. ‘Structural Tailwinds’ refers to areas of the economy which are growing at a faster rate than the national average economic growth rate. We note that these companies are not necessarily high-flying growth companies (for example, some non-bank lenders on PE ratios less than the market average fall under this strategy). Afterpay is the fund’s largest holding after its 30% appreciation over January and our decision to add to the position in November.

Going forward, we will release detailed newsletters every quarter (including a deep dive into a portfolio holding) and other updates when deemed appropriate. This will preserve a high level of quality content. 

(Another) Podcast with Frazis Capital

We recently thoroughly enjoyed recording another podcast with Frazis Capital Partners. Check out the discussion on “How We’re Different” on desktop here and on iTunes here. We provided details on Frazis Capital and its deep focus on the life sciences and technology in our last newsletter.

5 (more) Businesses on our CY2020 Watchlist

See the full CY2020 Watchlist on our website and analysis on the 5 other watchlist businesses at the end of our last newsletter.

Bank of Queensland (BOQ:ASX)Regional bank with fresh, proven management, driven to turn the bank around through competitiveness and technological advancement. Some painful writedowns may occur in the company’s troubled technology space before deploying newly raised capital to pivot the business back to growth.
 
Trades at 11.8X consensus forward PE multiple (consensus also presumes a -13% fall in EPS this year). All other major Australian banks trade at higher forward multiples: WBC at 13.0X, CBA at 17.4X, NAB at 12.2X, ANZ at 12.4X, BEN at 14.1X. Whilst the ‘big 4’ premiums could potentially be justified, BEN (another regional bank) appears unjustifiably expensive. We generally avoid speculating over potential M&A activity but believe that there is capacity for a regional bank deal.
Clover Corporation (CLV:ASX)Industrial manufacturer which utilises proprietary microencapsulation technology to deliver powders (both dairy and non-dairy) and oils (tuna). 
 
CLV’s microencapsulation technology (which removes any undesirable fishy odour or taste) gives the business an economic moat which supports long term compounding of capital (ROE is currently +24%). There are positive short-term tailwinds as Europe faces new DHA requirements.
 
At 24.7X consensus forward EV/EBITDA, +26% EBITDA growth and low leverage of 37% Debt/EBITDA, the business is attractively valued.
Resimac Group (RMC:ASX)Non-bank lender (which would fall under our ‘Structural Tailwinds’ strategy) with particular strength in residential mortgage backed securities (RMBS) origination. Specialising in prime mortgages, RMC carries far less default risk than other lenders.
 
At 11.6X consensus forward PE and strong double-digit growth in an industry where most businesses are struggling to grow their loanbook, RMC is a very attractive alternative to traditional bank stocks (which make up around 20% of the Australian market).
Universal Coal (UNV:ASX)South African thermal coal miner with a strong project pipeline and healthy balance sheet, paying a 12.5% yield (at a low payout ratio). 1.4X forward EV/EBITDA with positive earnings growth is a very low valuation even by thermal coal standards.
 
Eskom (state owned utility) has strong offtake contracts with UNV, with little risk that South Africa reduces its dependency on coal-fueled power generation over the midterm.
 
However, risks arise from recent scrutiny of Eskom’s supply contracts (and Eskom’s shaky financial stance), as well as general negative sentiment towards thermal coal. There is also a low proportion of revenue generated through exports, with reliance on South Africa’s economy.

Terracom (TER:ASX) recently took a 20% holding in the company in return for cash and scrip, at an implied valuation premium of roughly 50%. 
Viva Leisure (VVA:ASX)Leading Australian gym/health club operator with many membership options across 7 brands, as well as a history of earnings accretive acquisitions in strategically significant areas.
 
Viva’s gyms are well regarded in the industry, and its investments in technology are helping to develop a stronger brand with stickier customers than most gyms.
 
Valuation Risk?
Run rate guidance for $85M of revenue and $21M EBITDA (current market capitalisation is around $170M). Despite the company’s internally forecasted revenue growth rate of 77% (much of which is inorganic) and EBITDA growth rate of 97%, gyms often sell on EV/EBITDA multiples of <3X (around ⅓ of VVA’s current valuation) due to lack of loyalty and virtually non-existent customer satisfaction in the industry over the long term.

We have already dipped our toe into the watchlist, moving Clover Corporation from the watchlist to the portfolio during January as a small position. We like the area of the supply chain in which the business operates and believe it can generate alpha over the long-term. 

Quip of the Month

“We don’t have to be smarter than the rest. We have to be more disciplined than the rest.”– Warren Buffett

There has never been a better time to be a retail investor. In developed markets, strict laws and the proliferation of tech-driven financial products has given retail investors the tools to compete with any city-centre analyst or portfolio manager… yet retail investors almost always underperform the market. We covered one of the key reasons for this underperformance in our September newsletter when discussing why LICs often trade at discounts to net tangible assets. The clashing basic human emotions of greed and fear destroy returns for both retail and professional investors. In September, we revealed that a whopping 85.1% of actively managed funds have underperformed the S&P500 since the GFC while 91.6% have underperformed over a 15 year period. Unlike actively managed funds, retail investors do not face pressure to lock in performance fees by selling positions as they grow (reducing volatility, short-term downside risk… and returns). We discussed the difficulties facing actively managed funds to take a long-term view in our August newsletter.

There is only one reason to invest in a business – to make a profit. But there are many reasons to sell a business (with varying degrees of justifiability) – life’s needs; life’s wants; something materially impacts future earnings; everyone says you’re wrong; bearish broker reports; online investing forum advice; your partner’s cousin’s dad claims to know something he shouldn’t; tomorrow’s recession; divorce; and more and more. With vast amounts of information available now, more than ever before, and user-friendly trading platforms, it has never been more compelling to press the sell button. Investors continue to do so at the worst possible times.

As we said in our End of Year Special, we use fundamental analysis to buy and hold core portfolio businesses (we always think of our position as if we are owning the whole business rather than just some of its ‘stock’). In our opinion, it is critical to lock out all other noise in the market to avoid buying high and selling low, as well as general overtrading. Such discipline ensured that we never sold any of our top 3 portfolio performers during 2019: EML Payments, Afterpay, Pointsbet. These 3 investments continued to be our top performers in January, all appreciating over 10% during the month.Trading out of the market can be a very costly mistake when considering that the broader Australian index (most other major global indices have produced similar results) has generated a positive return in 81% of years since 1900, with an average gain of +13.2%/annum:

In fact, missing the top 5 best days on the Australian market over the last 20 years would have cost around 40% of return. The losing battle of market timing is further explained here

The S&P500 tells a very similar story. The graph below shows just a handful of reasons to sell equities since the GFC. The general result of doing so – disastrous.

Remaining disciplined is key. There must always be a set of compelling and justifiable reasons to press the sell button. 

If you would like further details regarding our activities, we are always happy to discuss portfolio positions. We encourage you to follow us on Instagram and Twitter, where we share more regular bite-sized commentary.

Kind Regards,

Insufficient Capital

Insufficient Capital March Update

This, Too, Shall Pass…

Performance Figures

The portfolio fell -41.4% over the March quarter, underperforming the ASX300 performance of -24.3% by -17.1%. We are very disappointed but always endeavour to allocate capital (according to our Ground Rules) to avoid underperformance during the 81% of years that markets rise. The quarter was dominated by three very distinct months: January – a continuation of the 2019 equities bull run, February – coronavirus (COVID-19) strikes equity markets, March – global monetary and fiscal stimulus disastrously fails to address fears of a pandemic-induced recession. Track the virus on this live dashboard

History tells us not to panic. 

The graph below reveals that one month after the declaration of an epidemic, the average performance of the MSCI World Index is +0.44%, while 6 month average performance is +8.5%. COVID-19 has been far worse because of the increased role of China in the global economy (China now represents around 20% of worldwide GDP) and the proliferation of global trade. Should we have acted? Everyone’s hindsight is always 20/20 and whilst it would have been nice to buy businesses at lower valuations, selling them because of pandemics is not our strategy. We buy and hold businesses. Eventually, the virus will pass and most people will probably wish they’d bought the dip. We’ll find out in the coming months.

The last time equities significantly corrected occurred from October-December 2018. The S&P500 fell 17.5% from top to bottom while the ASX300 fell 12.1%. At the start of the 2018 correction, our three largest holdings were: Cooper Energy (COE:ASX), Starpharma (SPL:ASX) and Afterpay (APT:ASX). Our monthly performance over the three months was: -9.4%, -0.5%, -6.6%. Our monthly performance during the 4 months following the correction was: +4.1%, +5.3%, +7.7%, +8.6%. Over the 7-month period from the ASX300’s peak to peak, we outperformed the index by +10.1%. We suffered a larger drawdown but recovered much more strongly. We believe that our portfolio consists of high quality businesses without exposure to areas facing the greatest earnings risks: education, hospitality and travel. 

The top contributor during the quarter was Stanmore Coal (SMR:ASX) – note: SMR is subject to a takeover bid announced on the 2nd of April – while the largest detractor was EML Payments (EML:ASX). The weighted average market capitalisation of our portfolio is $1.6 billion. The fund is currently fully invested and most heavily weighted to our ‘Structural Tailwinds’ strategy. 

A More Consolidated Portfolio

Over the quarter, we consolidated the portfolio more heavily towards our best ideas. It is common for portfolio managers to run a side portfolio of a handful of their best ideas. Whilst this may seem like a lack of manager alignment, very few investors will pay fees to managers who buy <10 stocks (particularly if they are household names like Facebook, Microsoft and Visa). A consolidated portfolio is inherently more volatile since it is driven by the performance of its few constituents. However, as discussed in our first newsletter, the volatility (standard deviation) of a portfolio approaches its limit very quickly as new investments are added. The average portfolio of 10 varied investments is only around 20% more volatile than a portfolio of 100 investments… and as one’s investment timeframe extends, volatility becomes less important. Should an investor with a 20 year investment horizon really care where their portfolio lies on the graph below? After a 10 stock portfolio, probably not.

We confess to running a small side portfolio of our best three (often less) ideas. This portfolio has doubled since inception (1 July 2017) with few portfolio changes. Its performance occurred despite three drawdowns of over 15% during the period (including the current sell-off). Unfortunately, we decided to align the two portfolios just prior to the most recent (and largest) drawdown. 

In future, three businesses will make up at least 40% of the Insufficient Capital portfolio. Whilst there will be increased volatility, its performance will now closely mirror the side portfolio through good times… and highly disruptive viruses. The three core businesses will always satisfy our ‘Ground Rules’ and vigorous fundamental research. 

Warren Buffett said that “Diversification is protection against ignorance. It makes little sense if you know what you are doing.” In a couple of year’s time, we (and you) will see if we are ignorant or add alpha. There is nowhere to hide. The returns are there for all to see. In line with a handful of long-term investors, including Christopher Davis (See the ‘Quip of the Month’ at the end of this letter), we focus on absolute returns rather than worrying too much about portfolio volatility. 

We recently enjoyed recording another podcast with Frazis Capital Partners. Check out the discussion on the coronavirus and two Australian burns innovators (Polynovo and Avita) on desktop here and on iTunes here

SmartPay Holdings 

During the quarter, we initiated SmartPay (SMP:ASX) as one of our three core businesses. Smartpay is Australia and New Zealand’s largest full-service EFTPOS provider / merchant payments business. They have 35,000 EFTPOS terminals outstanding across over 25,000 merchants. It is the largest direct connector of terminals to Paymark, one of New Zealand’s two central electronic payment processing platforms (known as ‘switch providers’) and has a 20% market share of terminals in the country. The New Zealand business is mature ($18M of annual recurring revenue) whilst the Australian business is just getting started.

The Australian market opportunity is around 1 million terminals. Although SmartPay only has 0.4% of the Aussie terminal market (4000 terminals), it grew revenue by 32% last quarter. Australia’s big four banks are SmartPay’s key competition and continue to dominate national terminal count. They overcharge merchants, have terrible customer service, bear the cost of managing their own switches, lack focus on the business segment and have a poor reputation following the Australian banking royal commission. Tyro (TYR:ASX) has 45,000 terminals, while US payments giant, Square (SQ:NYSE), recently broke into the Australian market by targeting micro-merchants. 

Australian terminal and revenue growth:

In Australia, Smartpay initially offered merchants single-charge terminals with $35/month terminal rental (comparable to the New Zealand rental driven business model), running that product for 6 months. The business recently developed a zero charge terminal for the Australian market, with no monthly costs to the merchant and unlimited fee-free transactions – no scheme fees, interchange fees, acquirer fees, terminal rental fees. A 1.5% surcharge is added to each transaction and paid by the customer. The merchant does not pay anything but reserves the ability to transfer the customer’s cost to themself (e.g. for high spending and loyal customers). Smartpay offers free add on features including contactless payment, Alipay, WeChat cash out, tipping and MOTO. The key point of difference is cost. A typical Australian small business doing $25,000/month of transactions saves around $3,000/year using Smartpay over its competitors.

Smartpay avoids industries with prepayment risk such as travel agencies. They are very strong in small-medium enterprises in the hospitality industry. Large businesses demand lower prices from their payments provider. The banks focus on them with the hope of offering other financial products (e.g. debt facilities). Tyro now focuses on banking products rather than pure payments, using their banking licence. Smartpay is the only major operator with a complete focus on the payments business. No significant competitors (other than Square) have entered the market because there is a high moat. It takes at least 6 months of work to connect a new switch so switch providers tend to avoid talking to new entrants if they’re small operators.

Smartpay received a $70M offer from Verifone for its New Zealand business in November 2019. The New Zealand Commerce Commission’s decision on whether to approve the acquisition is due on 15 May. The $70M offer was double the market capitalisation of the entire company (including the Australian business) at the time. 

There could be a bidding war because all NZ transactions go through only two switch providers (Paymark – owned by Ingenico, Eftpos NZ – owned by Verifone). These market dynamics make Smartpay a very important asset for Ingenico. If the offer succeeds, Paymark would likely lose the significant 20% terminal share to Eftpos NZ since Verifone would change Smartpay’s switch provider from Paymark to Eftpos NZ post-acquisition. Ingenico paid $190M for Paymark in 2018 and risks losing a key revenue stream if Smartpay redirects transactions to the Verifone-owned switch provider.

Taking out the NZ business (presuming the $70M buyout goes through), the Australian business is currently valued at a measly $7.5M. Pre-COVID-19, it was on track to record $14M of annual recurring revenue this year. The current valuation appears very low when considering the high growth of the Australian business and its superior margin (over the NZ business). Smartpay intends to spend the sales proceeds on debt repayment, Australian growth and a significant dividend (or equivalent share buyback). Smartpay is currently valued at 5.2X consensus forward EV/EBITDA. However, this valuation will be even lower after the sale of the New Zealand business.

It is important to note that disruptive businesses like Tyro and Smartpay have flourished off the high fees and immobility of Australia’s big four banks. Smartpay could suffer continual margin erosion due to competition and ultimately have a low valuation multiple ascribed to it. 

Quip of the Month

“In a sense, we start with this mindset of building wealth over the long term. And in this way, we always say that we are absolute investors. We view it as if we are buying the entire business. We look for the returns to be driven by the cash the business produces over a long period of time.” – Christopher Davis (Davis Funds)

During times like these, it is easy to forget that long term returns are always sourced from future cash flows. Whilst the coronavirus will impact short-midterm cash flows, all portfolio businesses will make it out the other side (perhaps a little battered). 50% of our portfolio is debt-free with significant net cash. We are almost certain that none of our portfolio holdings will be forced to raise capital at their current low valuations (unlike shareholders in Webjet [WEB:ASX] who will bear the brunt of a recapitalisation 90% below its peak). Cash is king.

The eternal growth vs value debate is irrelevant to our portfolio construction. Faster growing companies (such as EML Payments) deserve higher valuation multiples and will return cash to investors as dividends at a later date. Slow growing companies (or those with mature assets) are already returning cash to investors (e.g. Stanmore Coal). There is always a fair price to pay for any company if its future cashflows can be forecasted.

If you would like further details regarding our activities, we are always happy to discuss portfolio positions. We encourage you to follow us on Instagram and Twitter, where we share more regular bite-sized commentary (recently, commentary has focused on the impact of the coronavirus on equity markets). 

We also recently published a coronavirus watchlist, where we highlight a handful of attractive businesses that we are looking at during this sell-off. Don’t get too excited – it is just a watchlist.

Remember to stay indoors, wash your hands and keep the most vulnerable of our community protected. #investfromhome

Kind Regards,

Insufficient Capital 

Exit mobile version